- Introduction
- Prerequisites
- Connection diagram
- IoT Hub configuration
- Connect RTU+ to PC
- RTU+ configuration
- Data visualization
- See also
- Next steps
Introduction
This guide contains step-by-step instructions on how to connect your Nettra RTU device to IoT Hub Community Edition through ethernet, using as sample, one of the many applications that the Nettra RTU has. In particular, this sample application will allow you to monitor temperature using IoT Hub web UI to display the data coming from the sensor.
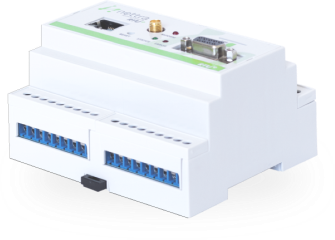
Nettra RTU
Nettra RTU called “RTU+” is a powerful IoT electronic device that has digital and analog inputs and outputs, as well as several integrated communication interfaces as modem, ethernet, 802.15.4, RS485, RS232 and GPS. It is an ideal product to implement monitoring, acquisition and control applications over a distributed data network.
The RTU+ is easly configurable via a RTU+ Configuration Interface. To adapt the RTU+ to each application, it runs a fully customizable script, accessible and editable from the Configuration Interface. In this guide we will provide one as an example quite simple and easy to understand.
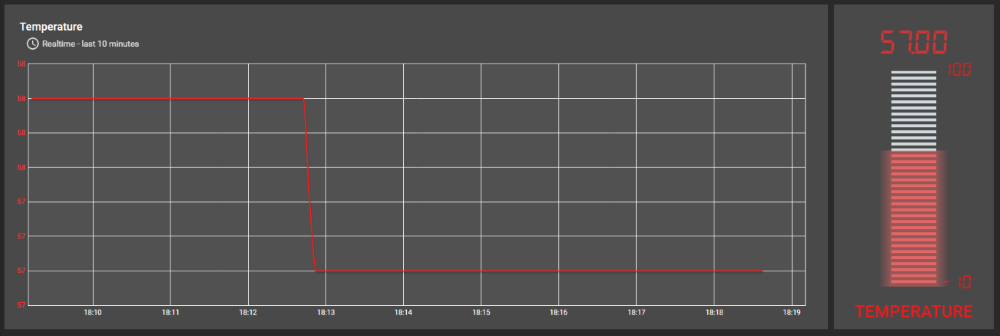
Once you complete this sample/tutorial, you will see your sensor data on a dashboard like the following on the right.
Prerequisites
Hardware
- 1x RTU+
- 1x Temperature sensor (Operation range: 4-20mA or 0-20V)
- 1x 12VDC supply voltage
- 1x USB to Serial cable
- 1x Ethernet cable
Software
- RTU+ Configuration Interface.
- You will need to have IoT Hub server up and running. Use either Live Demo or Installation Guide to install IoT Hub.
Connection diagram
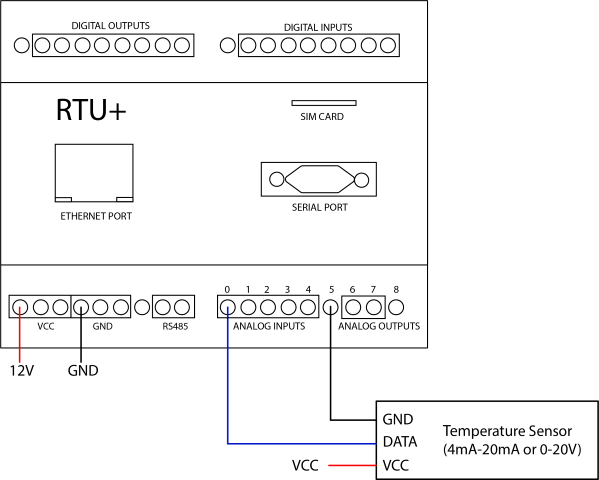
The following picture summarizes the connections for this simple project:
IoT Hub configuration
This step contains instructions that are necessary to connect your device to IoT Hub.
Sign up IoT Hub Web UI as live-demo. See Live Demo page for more details how to get your account.
Device
- Go to “Devices” section.
- Click ”+” button and create a device with the name “RTU+”. Set “Device type” to “default”.
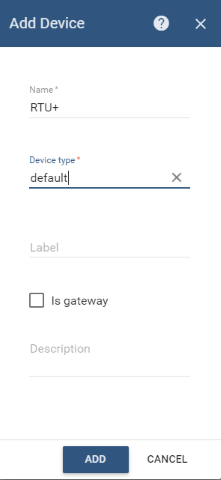
- Once device created, open its details and click “Manage credentials”.
- Copy auto-generated access token from the “Access token” field. Please save this device token. It will be referred to later as $RTU_DEMO_TOKEN.
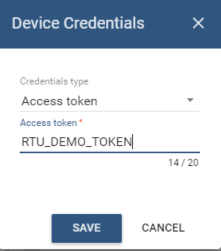
Dashboard
Download the dashboard file (.json) using this link. Use import/export instructions to import the dashboard to your IoT Hub instance.
Connect RTU+ to PC
-
Download and install last version of RTU+ Configuration Interface.
-
Once you have the RTU+ connected to the temperature sensor and the 12VDC power supply as shown in Connection Diagram section, connect the RTU+ to the PC using the USB-Serial cable (make sure you have all the necessary drivers installed for that).
-
Open the RTU+ Configuration Interface.
- Go to “Inicio”.
- Click “Serial”.
- Select the USB port “Puerto” you have connected the RTU+, “Baud rate”: “9600” (by default), and “Paridad”: “Sin paridad”.
- Click “Connect”.
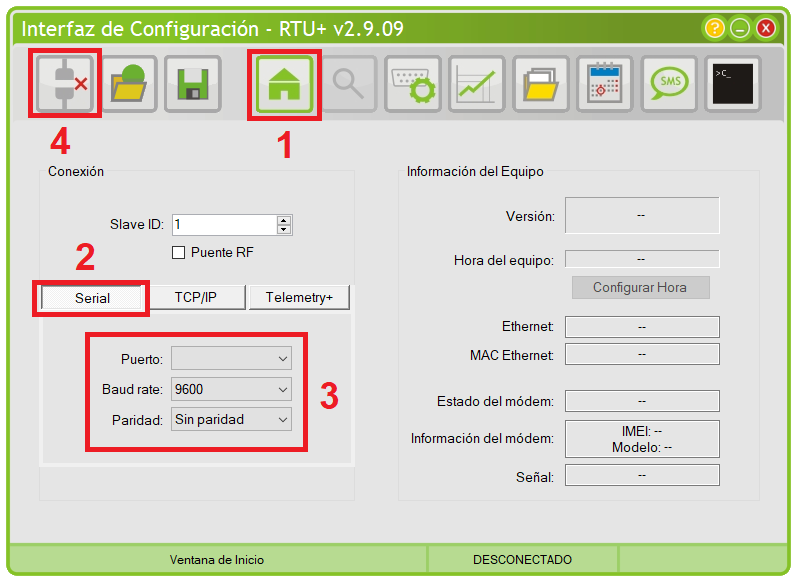
Once you are connected you should see this icon :

RTU+ configuration
Once you have your RTU+ connected to the PC, we can proceed with its configuration.
Ethernet
- Go to “Comunicaciones”.
- Click “Serial y Ethernet”.
- Tick the box “DHCP” as shown in next image.
-
Save clicking “Aplicar cambios”.
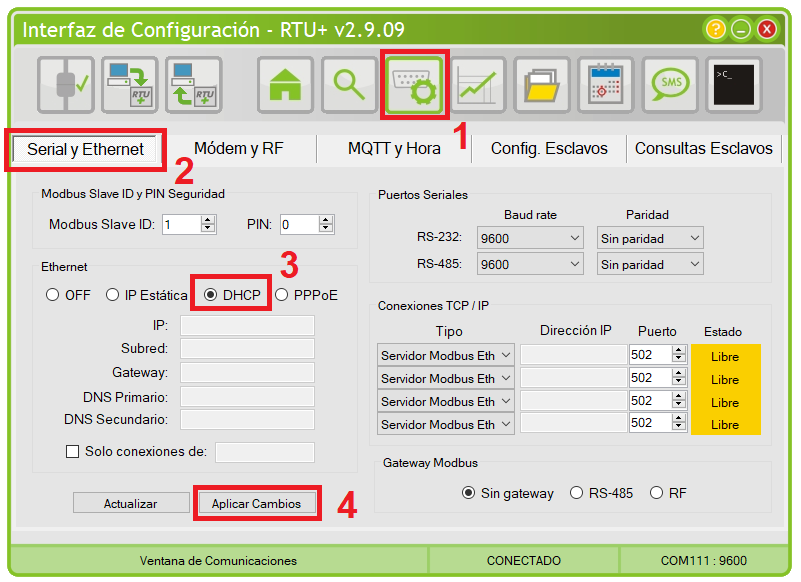
MQTT
- Go to “Comunicaciones”.
- Click “MQTT y Hora”.
- Fill the MQTT boxes as follow:
Interfaz : Ethernet Puerto : 1883
Servidor : IoT Hub HOST/IP address that is accessible within your local network. Specifyiothub.magenta.atif you are using live demo server.
Usuario : $RTU_DEMO_TOKEN (provided in Device subsection)
Contraseña : Leave empty
Client ID : RTU+
Telemetry Topic : v1/devices/me/telemetry
Attributes Topic : v1/devices/me/attributes
Formato : Telemetry+ -
Fill the Time Synchronization boxes as follow:
Interfaz : NTP Ethernet
Servidor : IoT Hub HOST/IP address that is accessible within your local network. Specifyiothub.magenta.atif you are using live demo server.
Frecuencia : 10
Huso : Write your time zone -
Click “Aplicar cambios” to save.
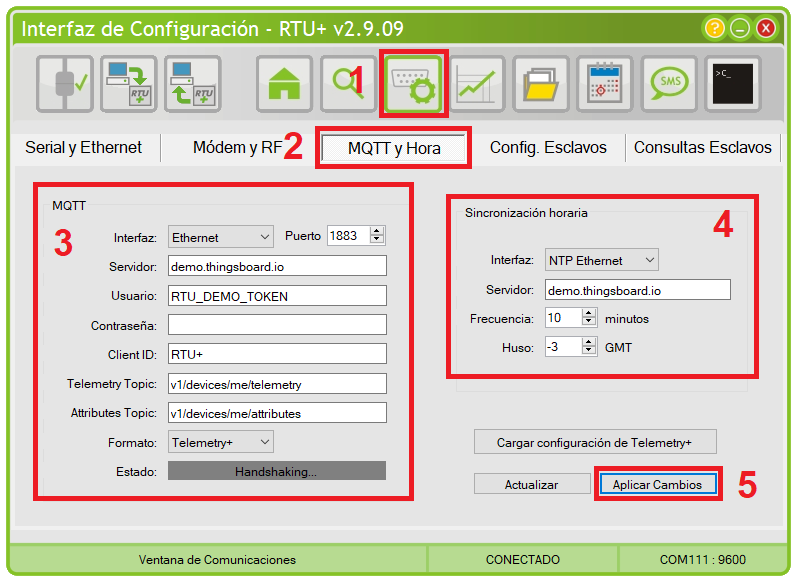
You should see in “Estado”: “Conectado” (MQTT status: Connected) (It could take some minutes the first time)

Time
-
Go to “Inicio”
-
Click “Configurar Hora”.
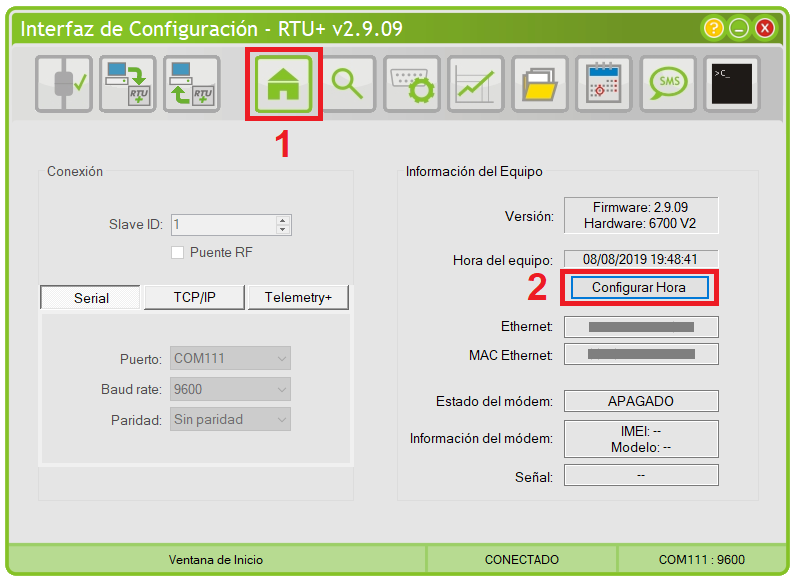
Analog input
-
Go to “Escalado de Entradas Analógicas”.
-
Here we have two possibles configurations, depending on your temperature sensor.
If your temperature sensor output range is between 4-20mA :
Select “Corriente” in “Entrada Analógica 0: “. Fill “X0” with “819” and “X1” with “4096”. Fill “Y0” with minimum sensor temperature and “Y1” with maximum sensor temperature.
Example: Sensor Range: -10°C to 100°C. “X0” = 819, “Y0” = -10, “X1” = 4096 and “Y1” = 100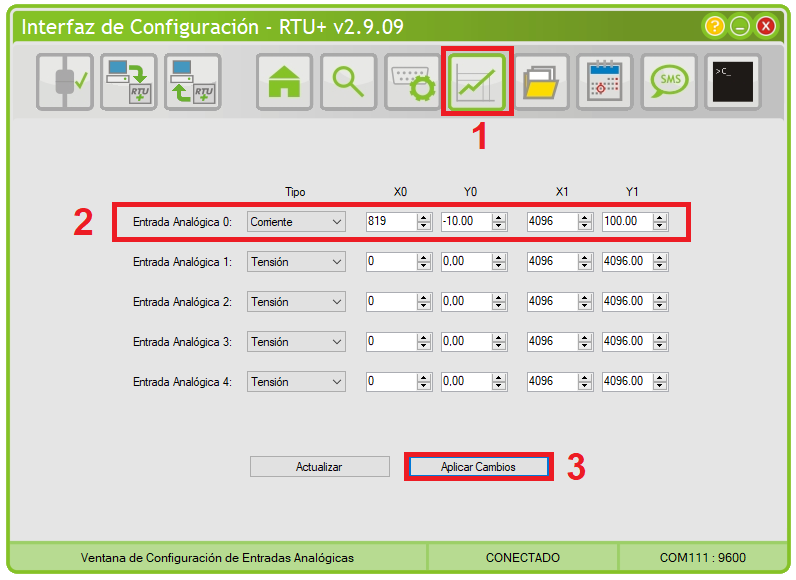
If your temperature sensor output range is between 0-20V :
Select “Tensión” in “Entrada Analógica 0: “. Fill “X0” with “0” and “X1” with “4096”. Fill “Y0” with minimum sensor temperature and “Y1” with maximum sensor temperature.
Example: Sensor Range: -10°C to 100°C. “X0” = 0, “Y0” = -10, “X1” = 4096 and “Y1” = 100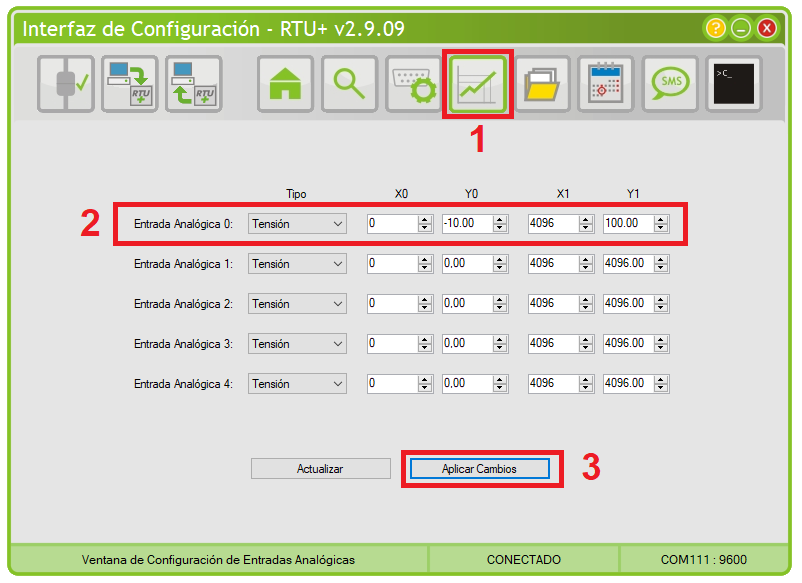
-
Click “Aplicar cambios” to save.
Script
- Download this script.
1
2
3
4
5
6
7
8
9
10
11
12
13
14
15
16
17
18
19
20
21
22
23
24
25
26
27
28
29
30
31
/*
 * DESCRIPTION :
 * - Monitor temperature each 20 seconds.
 *
 * INPUTS:
 * - Temperature sensor : Analog Input 0
 */

// Constants
const TLOG = 20000;  // [Miliseconds]

// Variables definition
loggable float temperature;   // [ºC]
ulong logTimer;
<span style="color: green"> Some green text </span>
// Alias
alias sensorTemperature as AInEscalado[0];

// Variables initialization
logTimer = ConfigurarTimeout(0);

// Code
while(1)
{
   if (Timeout(logTimer))
   {
      logTimer = ConfigurarTimeout(TLOG);
      temperature = sensorTemperature;
      Log(temperature);
   }
}
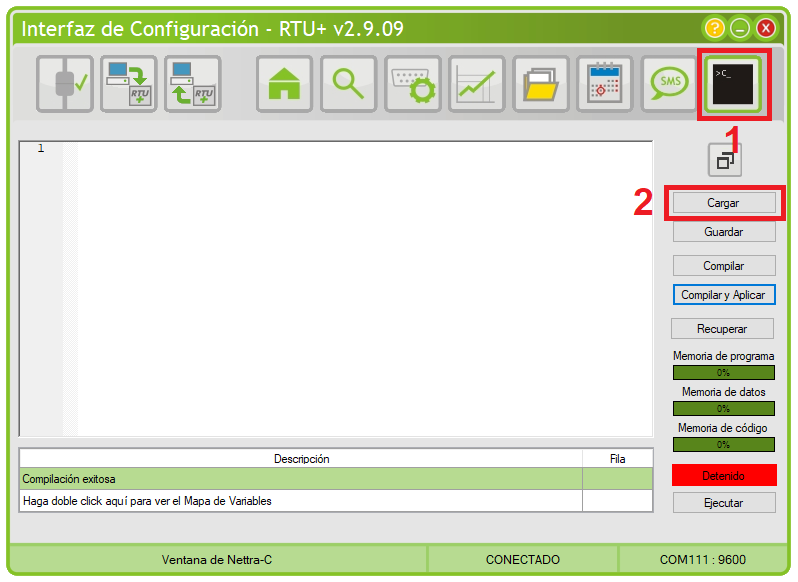
- Go to “Nettra-C”
-
Import the script clicking “Cargar”. If you want to make your own script, you can see the Nettra C user manual.
-
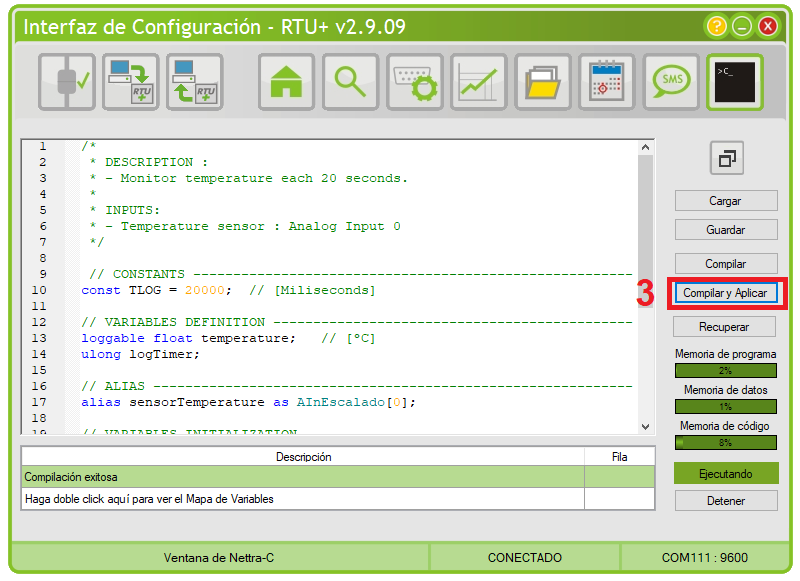
Compile and save the script in the RTU+ by clicking “Compilar y Aplicar”.
Data visualization
Finally, open IoT Hub Web UI in the Live Demo server with same user and password as IoT Hub configuration section.
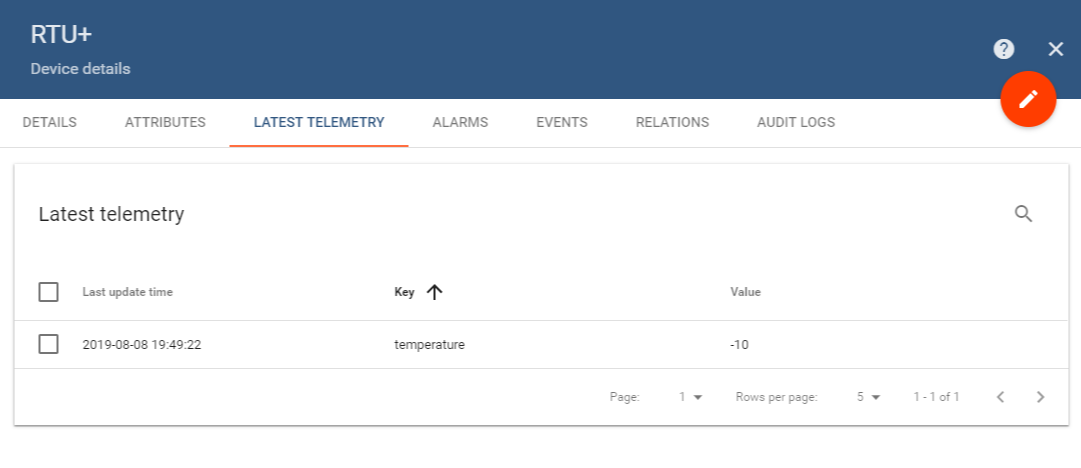
Go to “Devices” section and locate “RTU+ Device”, open device details and switch to “Latest telemetry” tab.
If all is configured correctly you should be able to see latest values of “temperature” in the table.
After, open “Dashboards” section then locate and open “RTU+” dashboard.
As a result, you will see a time-series chart displaying temperature level (similar to dashboard image in the introduction).

See also
Browse other samples or explore guides related to main IoT Hub features:
- Device attributes - how to use device attributes.
- Telemetry data collection - how to collect telemetry data.
- Using RPC capabilities - how to send commands to/from devices.
- Rule Engine - how to use rule engine to analyze data from devices.
- Data Visualization - how to visualize collected data.
Next steps
- Getting started guides - These guides provide quick overview of main IoT Hub features. Designed to be completed in 15-30 minutes.
-
Connect your device - Learn how to connect devices based on your connectivity technology or solution.
-
Data visualization - These guides contain instructions how to configure complex IoT Hub dashboards.
-
Data processing & actions - Learn how to use IoT Hub Rule Engine.
-
IoT Data analytics - Learn how to use rule engine to perform basic analytics tasks.
-
Advanced features - Learn about advanced IoT Hub features.
-
Contribution and Development - Learn about contribution and development in IoT Hub.
