This tutorial is to show you how to create an alarm when the device is offline for a certain period of time using RuleEngine.
- Use Case
- Background
Use Case
Let’s assume the following use case:
-
you have a device connected to IoT Hub and this device has a temperature sensor to collect and push the telemetry data.
-
the temperature sensor may stop pushing the telemetry data due to any kind of faults.
Therefore, in this case, you will need to configure IoT Hub Rule Engine to:
-
create an alarm if the device remains inactive for a certain period of time. This period of time can be defined in either of two ways:
-
The first way: by changing the global configuration parameter for the inactivity timeout.
This parameter is defined in thingsboard.yml (state.defaultInactivityTimeoutInSec) and by default it is set to 600 seconds (10 minutes). -
The second way: by overwriting this parameter for a particular device by setting the “inactivityTimeout” server-side attribute (value is set in milliseconds).
This way will be described in the following sections.
-
-
clear the alarm if the device becomes active.
Background
The IoT Hub Device State service is responsible for monitoring the device connectivity state and triggering the device connectivity events that are pushed to Rule Engine.
IoT Hub supports four types of events:
| Event Type | Description |
| Connect | triggered when the device connects to IoT Hub. |
| Disconnect | triggered when the device disconnects from IoT Hub. |
| Activity | triggered when the device pushes a telemetry, an attribute update or RPC command. |
| Inactivity | triggered when the device is inactive for a certain period of time. |
This tutorial will explain in details the device Inactivity event and it will show you how to:
-
create Inactivity alarms using Rule Engine.
-
configure a parameter for the inactivity timeout.
Adding the Device
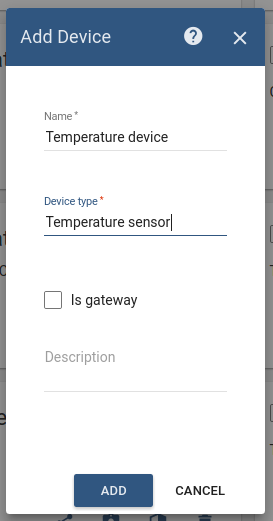
- Add a Device entity in IoT Hub.
- Enter the Device name as Temperature device, and the Device type as Temperature sensor:
Configuring the Device
-
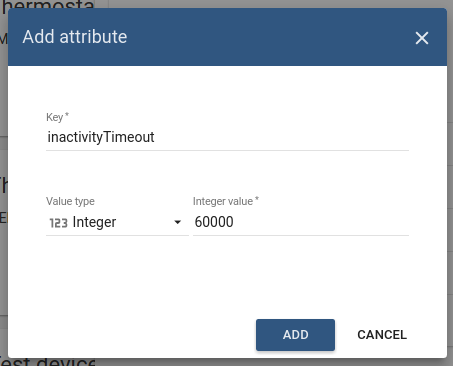
Go to Devices -> Temperature device -> Attributes -> Server attributes and Press Add button;
-
Set “inactivityTimeout” attribute, for example, to a value equals 60000 milliseconds.
Configuring the Rule Chain
The following screenshot shows the initial Root Rule Chain. Please, note that the irrelevant rule nodes have been removed from the Root Rule Chain.

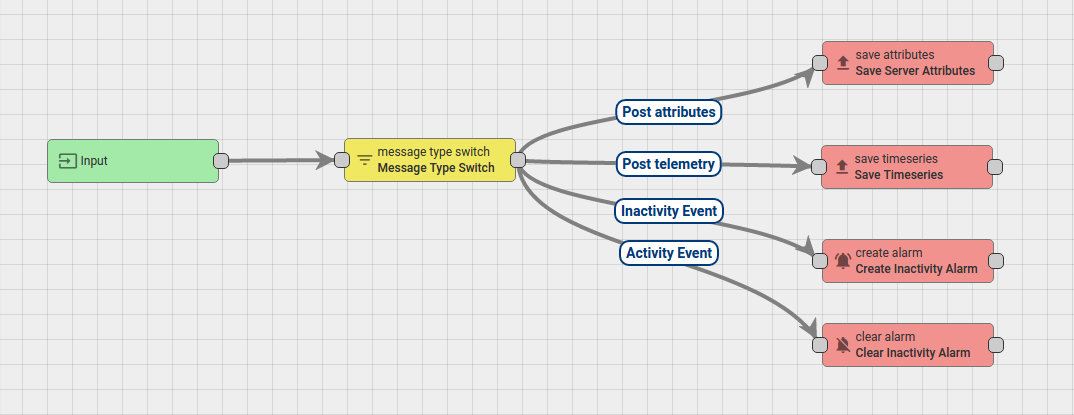
The default rule chain has been modified by adding the following two action nodes:
-
The Create alarm node: connected to the Message Type Switch node with a relationship type Inactivity Event;
-
The Clear alarm node: connected to the Message Type Switch node with a relationship type Activity Event.
The following screenshot shows how the final Rule Chain should look like:
-
Download the attached json file for the rule chain indicated above and import it.
-
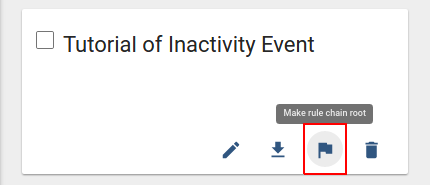
Don’t forget to mark the new rule chain as “root”.
Also, you can create the new Rule Chain from scratch. The following section shows you how to create it.
Creating a new Rule Chain (Tutorial of Inactivity Event)
-
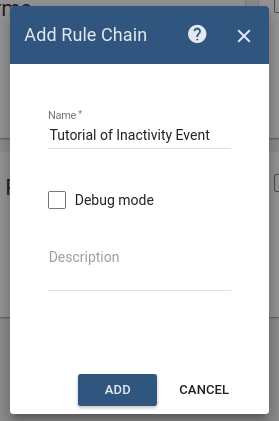
Go to Rule Chains -> Add new Rule Chain
-
Enter the Name field as Tutorial of Inactivity Event, then click the ADD button.
-
The new Rule Chain is created. Don’t forget to mark it as “root”.
Adding the required nodes
In this tutorial, you will create 5 nodes as it will be explained in the following sections:
Message Type Switch node
Add the Message Type Switch node and connect it to the Input node.
This node will route the incoming messages according to the message type, namely:
-
POST_TELEMETRY_REQUEST;
-
POST_ATTRIBUTES_REQUEST;
-
ACTIVITY_EVENT;
-
INACTIVITY_EVENT.
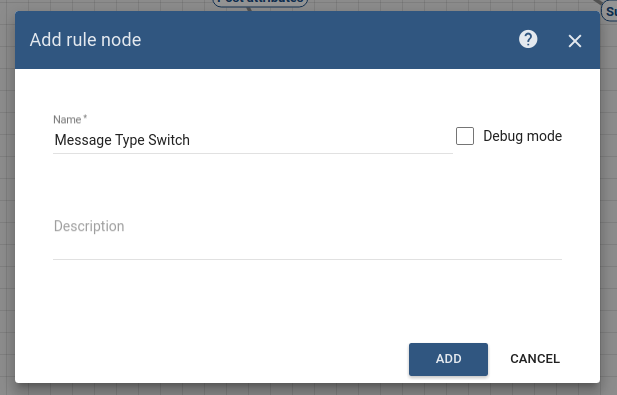
Enter the Name field as Message Type Switch, then click the ADD button.
Save Timeseries node
Add the Save TimeSeries node and connect it to the Message Type Switch node with a relationship type Post telemetry.
This node will store the TimeSeries data from the incoming Message payload into the database and link it to the Device that is identified by the Message Originator.
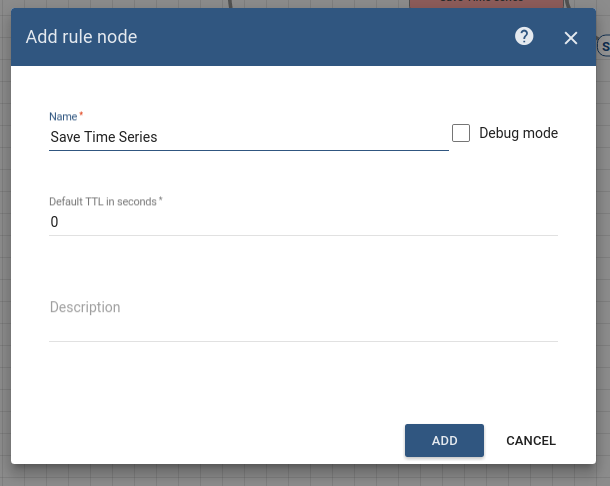
Enter the Name field as Save Time Series.
Save Server Attributes node
Add the Save Attributes node and connect it to the Message Type Switch node with a relationship type Post attributes.
This node will store attributes from the incoming Message payload into the database and link them to the Entity that is identified by the Message Originator.
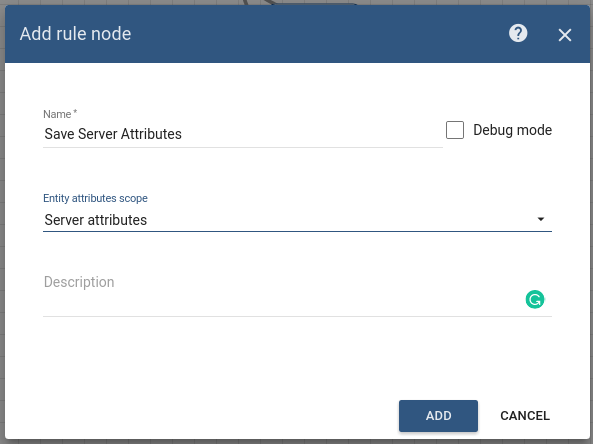
Enter the Name field as Save Server Attributes.
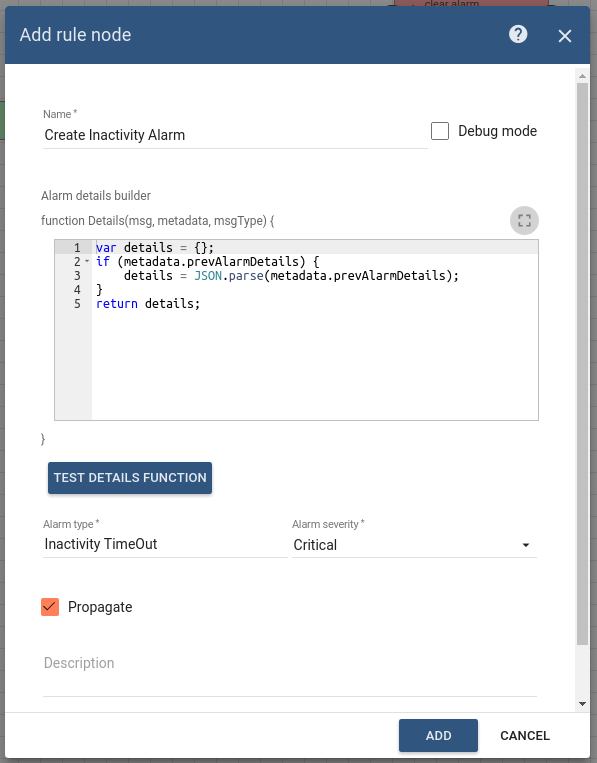
Create Inactivity alarm node
Add the Create alarm node and connect it to the Message Type Switch node with a relationship type Inactivity Event.
This node tries to load the latest Alarm with the configured Alarm Type for the Message Originator. If Uncleared Alarm exists, then this Alarm will be updated, otherwise, a new Alarm will be created.
- Enter the Name field as Create Inactivity Alarm and the Alarm type as Inactivity TimeOut.
Clear Inactivity alarm node
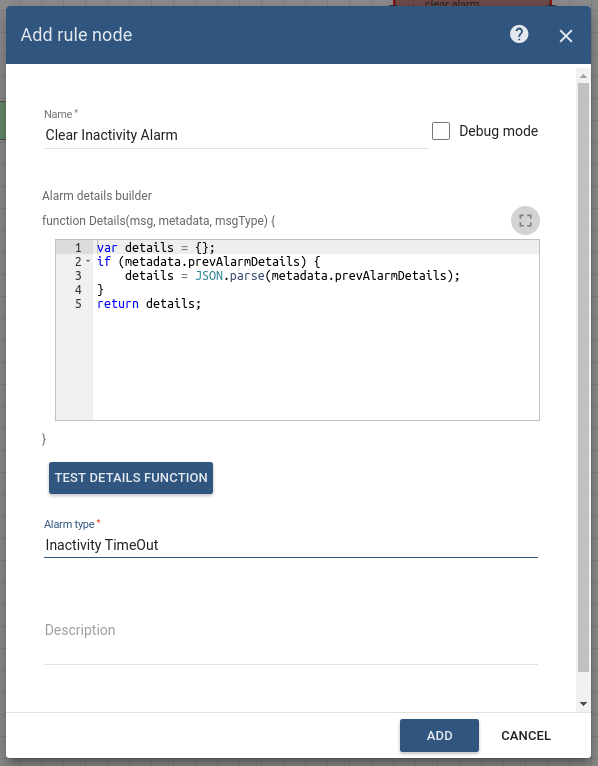
Add the Clear alarm node and connect it to the Message Type Switch node with a relationship type Activity Event.
This Node loads the latest Alarm with the configured Alarm Type for the Message Originator and Clear the Alarm if it exist.
- Enter the Name field as Clear Inactivity Alarm and the Alarm type as Inactivity TimeOut.
This Rule chain is now ready and you need to save it.
How to verify the Rule Chain and Post telemetry
- Use the Rest APIs, Telemetry upload APIs, for posting the device telemetry.
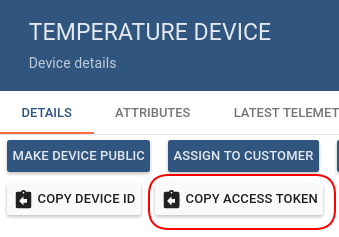
Please, note that you will need to copy the device access token from the device, Temperature device, as shown in the following screenshot.
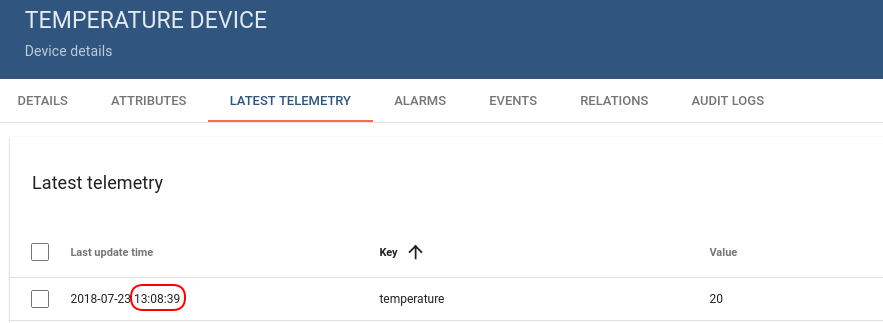
Try to post temperature = 20. Alarm should be created a minute after the telemetry post:
1
2
3
curl -v -X POST -d '{"temperature":20}' http://localhost:8080/api/v1/$ACCESS_TOKEN/telemetry --header "Content-Type:application/json"

***you need to replace $ACCESS_TOKEN with the actual device token**

Also, you can:
-
configure the Dashboard by adding an alarm widget to visualize the alarms.
-
define an additional logic for alarm processing, for example, sending an email.
Please refer to the first two links under the See Also section to see how to do this.
See Also
-
Create & Clear Alarms: configure dashboard guide - to learn how to add an Alarm widget to the dashboard.
-
Send Email guide.
-
Device Connectivity Status guide.
Next steps
-
Getting started guides - These guides provide quick overview of main IoT Hub features. Designed to be completed in 15-30 minutes.
-
Connect your device - Learn how to connect devices based on your connectivity technology or solution.
-
Data visualization - These guides contain instructions on how to configure complex IoT Hub dashboards.
-
Hardware samples - Learn how to connect various hardware platforms to IoT Hub.
-
Advanced features - Learn about advanced IoT Hub features.
-
Contribution and Development - Learn about contribution and development in IoT Hub.
