- Prerequisites
- Step 1. Provision device
- Step 2. Connect device
- Step 3. Create dashboard
- Step 4. Configure alarm rules
- Step 5. Create alarm
- Step 6. Alarm notifications
- Step 7. Share dashboard with customers
- Next steps
- Your feedback
This guide demonstrates basic usage of popular IoT Hub features. You will learn how to:
- Connect devices to IoT Hub
- Push data from devices to IoT Hub
- Build real-time dashboards
- Create a Customer and share the dashboard with them.
- Define thresholds and trigger alarms
- Set up notifications via email, SMS, mobile apps, or integrate with third-party services.
For simplicity, we'll visualize data from a temperature sensor.
Prerequisites
You will need to have access to IoT Hub.
Step 1. Provision device
As an example, let's add a device that will transmit the following data to IoT Hub platform: the device's name and temperature readings as telemetry.
To add a new device, follow these steps:
- Login to your IoT Hub instance and open Device Groups page.
- Navigate to default Device group “ALL”.
- Click on the "+" icon in the top right corner of the table and then select "Add Device".
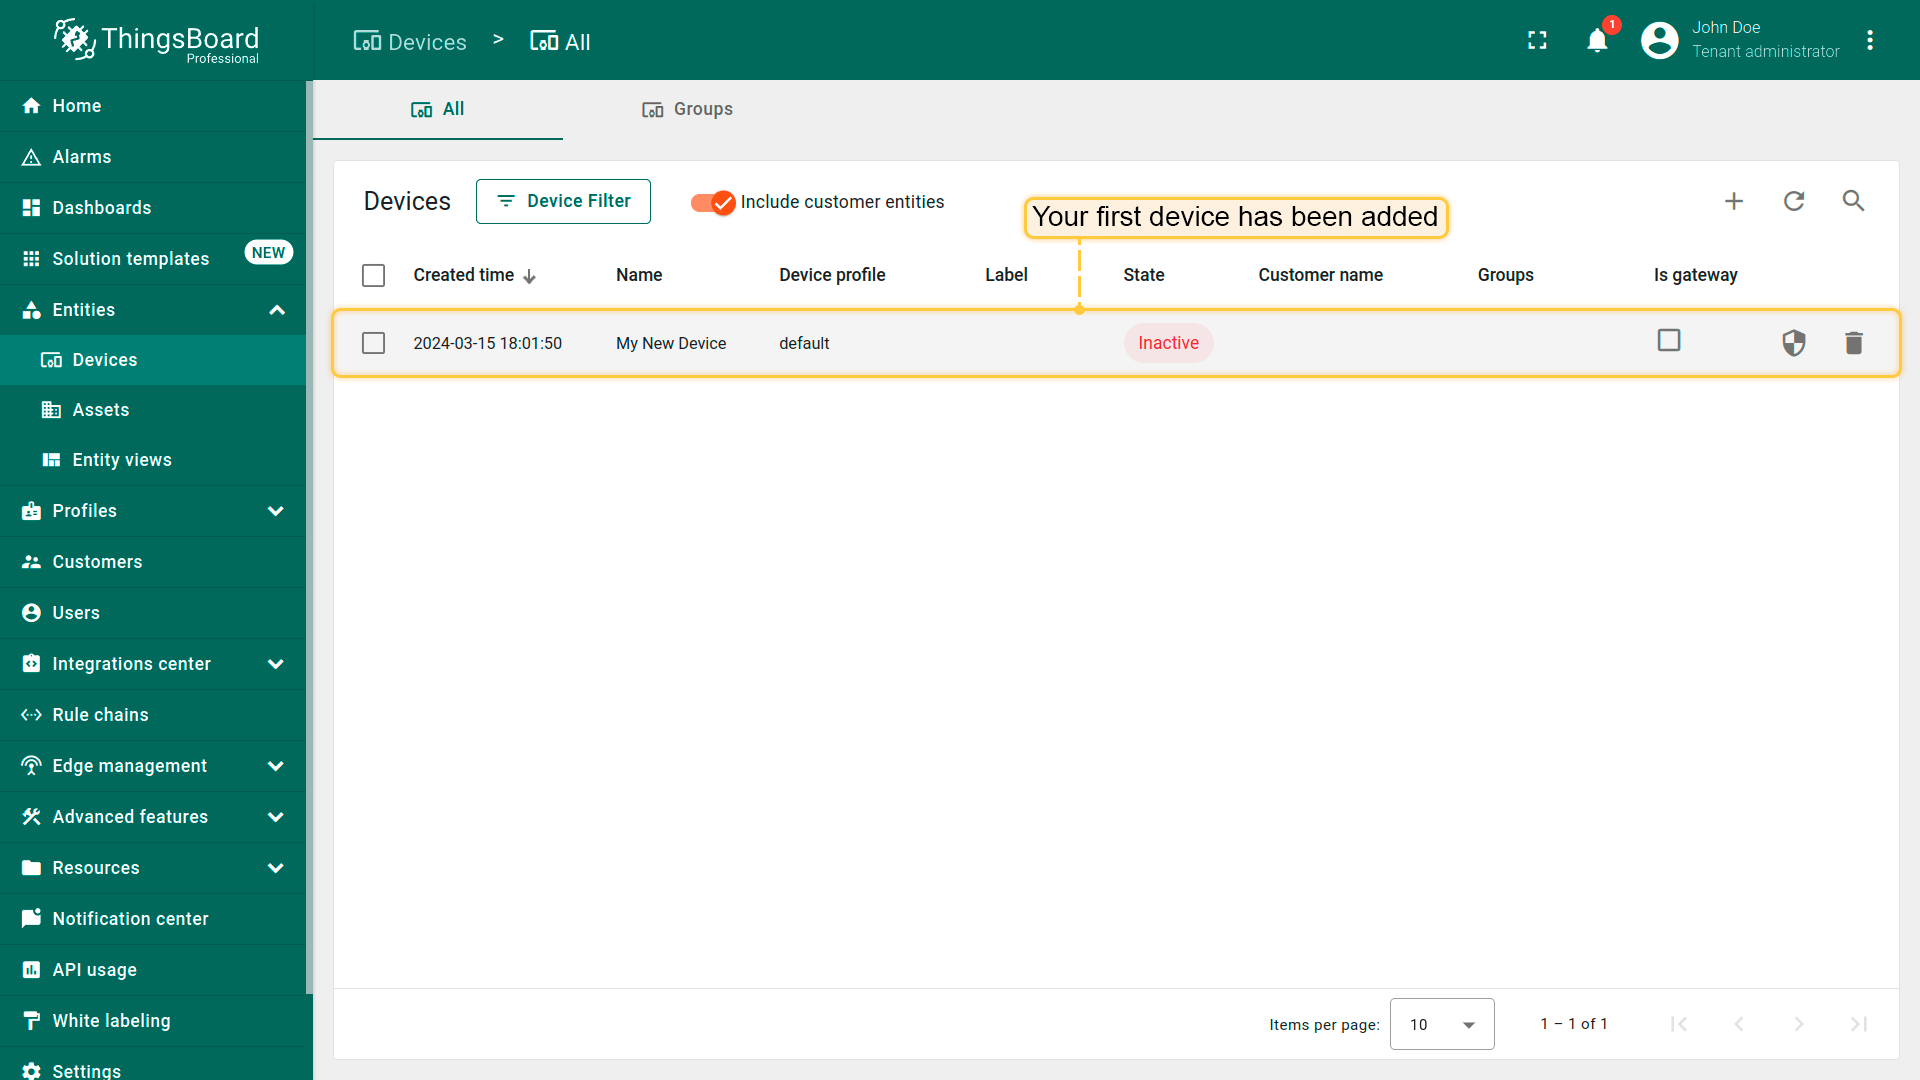
- Input device name. For example, "My New Device". No other changes are required at this time. Click "Add" to add the device.
- Congratulations on adding your first device! As you add more devices, they will be added at the top of the table, as the table automatically sorts devices by their creation time, with the newest ones listed first.


You will also receive a notification upon adding devices. Click the bell icon (top right) to view notifications.
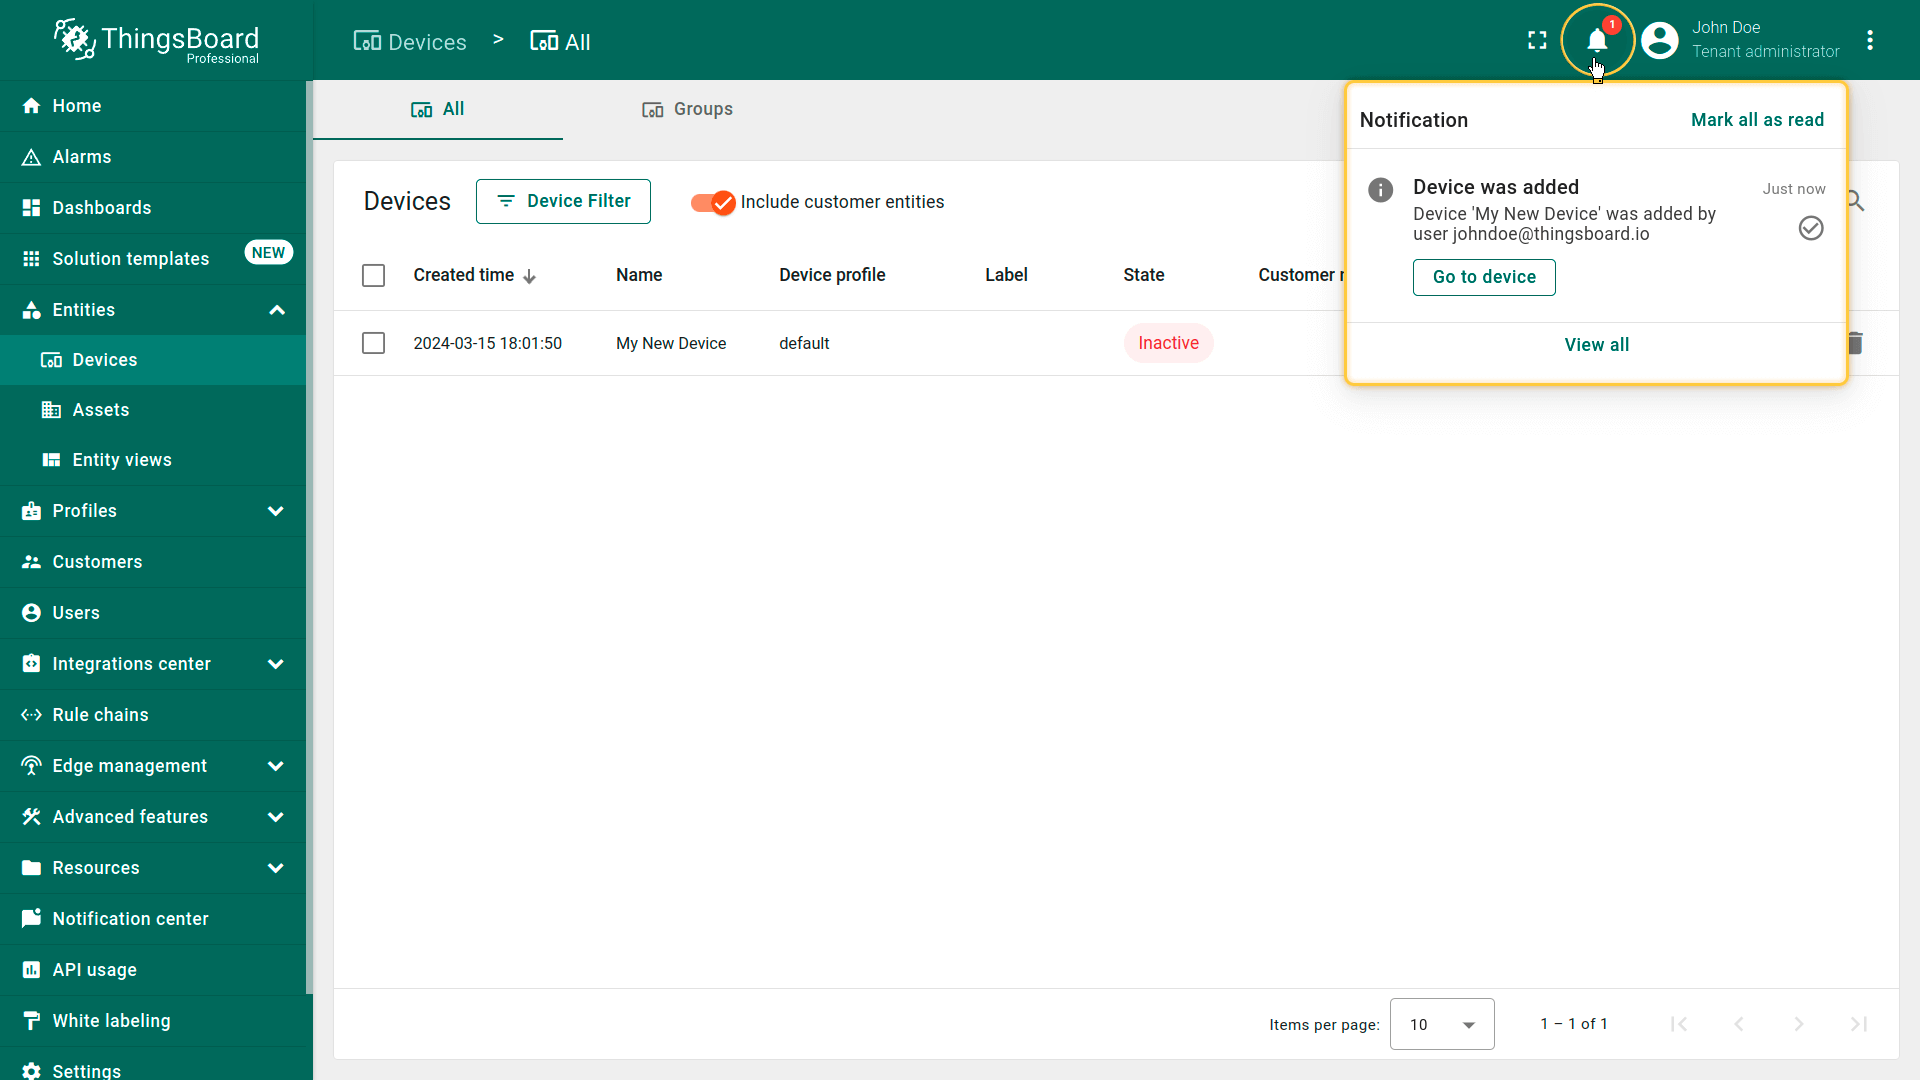
Learn more about notifications here.
Additional provisioning methods
- Bulk provisioning: Import multiple devices via CSV through the UI.
- Device provisioning: Configure devices to self-register automatically.
- REST API provisioning: Manage devices programmatically through APIs.
Step 2. Connect device
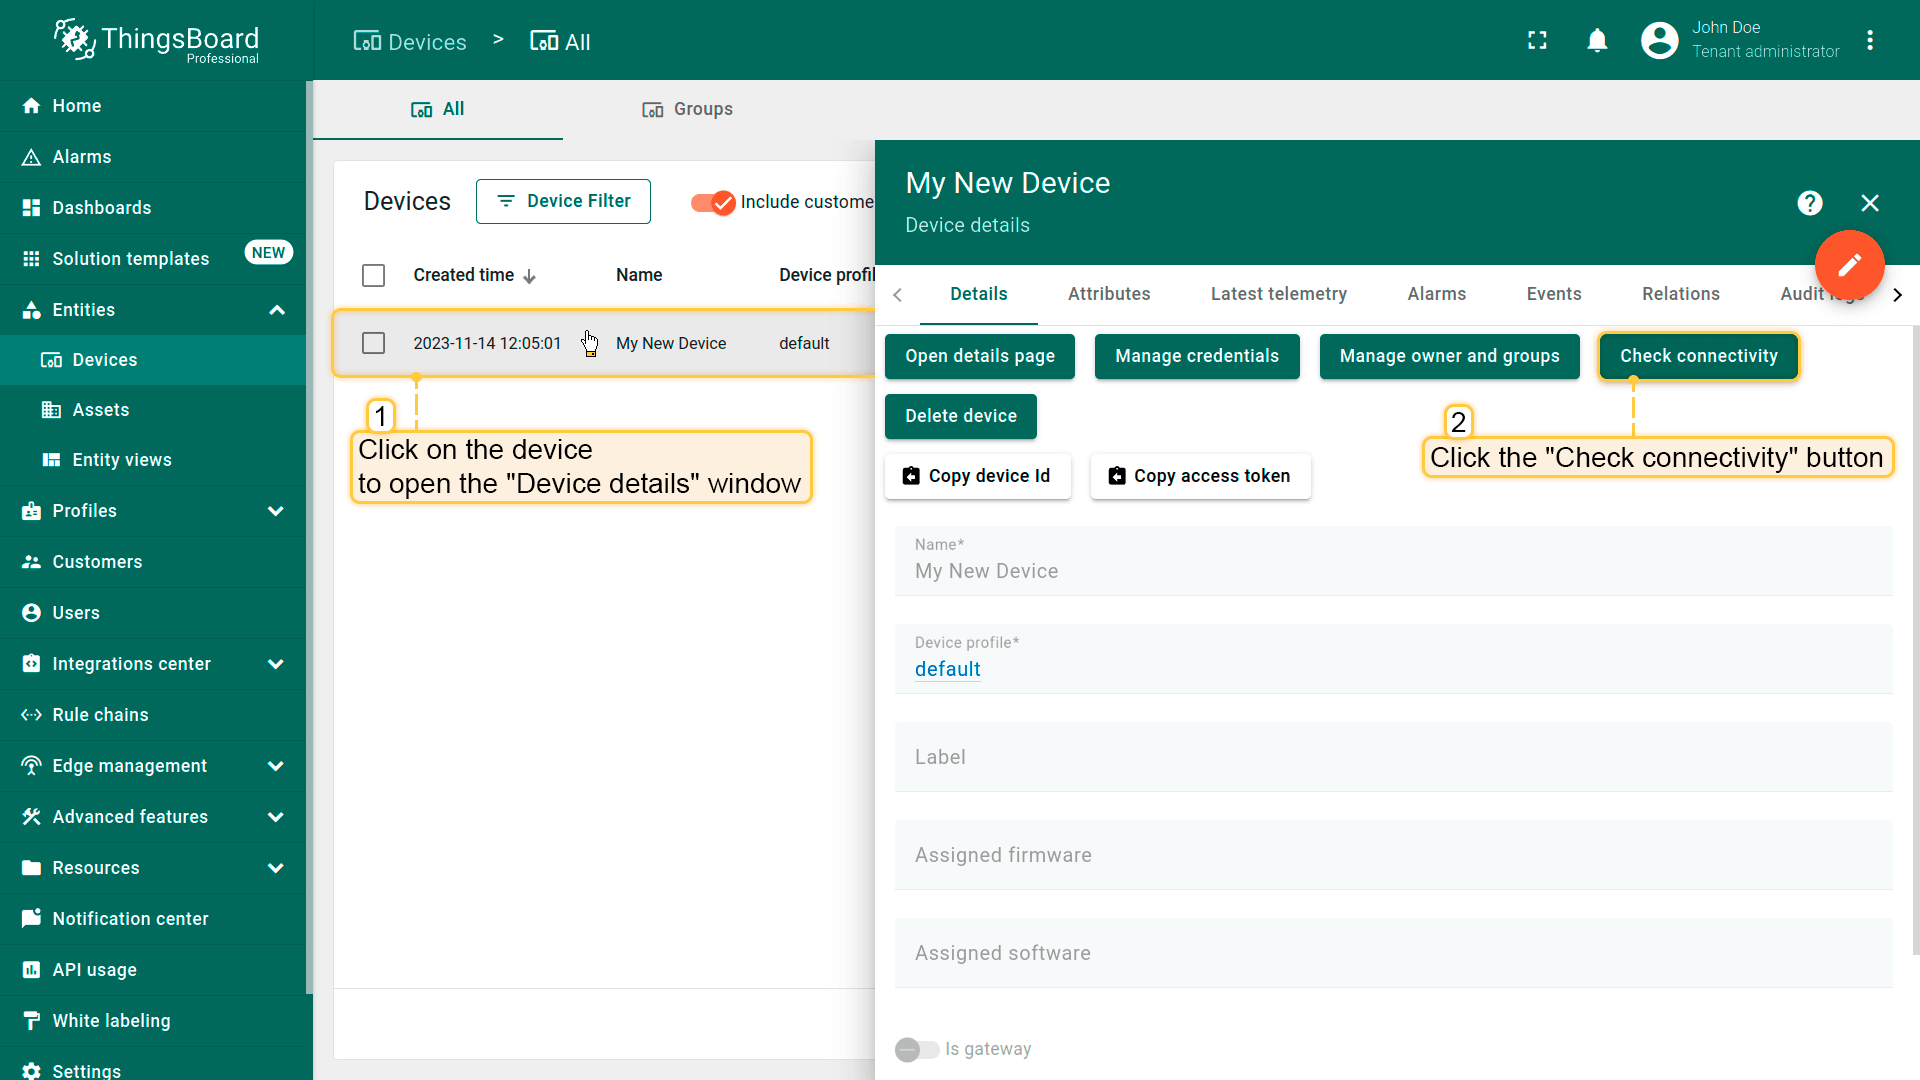
Let's verify your device's connection to IoT Hub:
- Click on your device, then click the "Check connectivity” button in the "Device details" window;
- Click "Copy access token". Token will be copied to your clipboard. Save it to a safe place.

Explore IoT Hub API reference. Here you will find more detailed information about all supported protocols for connecting devices.
Step 3. Create dashboard
A dashboard in IoT Hub allows users to visualize and monitor data collected from IoT devices.
Let's create a dashboard and add three widgets to it in order to display a list of entities and their latest values, as well as show alarm signals related to the specified entity.
Step 3.1 Create an empty dashboard
To create a new dashboard, follow these steps:
- Open Dashboard Groups page. Open default dashboard group “All”. Click on the "+" icon in the top right corner to create a new dashboard.
- Input dashboard name. For example, "My New Dashboard". Click "Add" to add the dashboard.
- Now your dashboard should be listed first, since the table sorts dashboards using the time of the creation by default. Click on the "Open dashboard" icon.


Step 3.2 Add an Entities table widget
The “Entities table” widget displays a list of entities and their latest values. The list of entities corresponds to selected devices or other entities, and filters with the ability of additional full-text search and pagination options.
To add the table widget we need to select it from the widget library. Widgets are grouped into widget bundles. Each widget has a data source. This is how the widget “knows” what data to display. To see the latest value of our “temperature” data that we sent during step 2, we should configure the data source.
Let's add your first widget:
- Enter edit mode. Click on the pencil button in the bottom right corner.
- Click "Entity Aliases" icon in the top right part of the screen. You will see an empty list of Entity aliases.
- Click "Add alias".
- Input alias name, for example "MyDevice". Select "Single entity" Filter type. Select "Device" as Type and type "My New" to enable autocomplete. Choose your device from the auto-complete and click on the needed device.
- Click "Add" and then "Save".
- Finally, Click "Apply changes" in the dashboard editor to save the changes. Then you should enter edit mode again.


Congratulations! You've added your first widget.
In the “Entities table” widget, there are two columns. The first column displays the device's name, and the second column displays the value of the “temperature” key (device telemetry). So, each column corresponds to an added key.
Now you are able to send a new telemetry reading (as in Step 1), and it will immediately appear in the table.
Step 3.3 Add a Chart widget
Chart widgets allow you to display time series data with customizable line charts and bar charts.
To add the chart widget we need to select it from the widget library. Chart widget displays multiple historical values of the same data key (“temperature” in our case). We should also configure the time window to use the chart widget.
- Enter edit mode. Click on the "Add new widget" button.
- Select "Cards" widget bundle. Select "Latest values" tab. Click on the header of the Entities widget. The "Add Widget" window will appear.
- Click "Add" to add the data source. Widget may have multiple data sources, but we will use only one in this case.
- Select "MyDevice" entity alias. Then click on the input field to the right. The auto-complete with available data points will appear. Select "temperature" data point and click "Add".
- Resize the widget to make it a little bigger. Just drag the bottom right corner of the widget. You can also play with the advanced settings if you want to edit the widget.


Congratulations! You have added the chart widget. Now you are able to send a new telemetry reading, and it will immediately appear in the chart.
You can also adjust the time interval for displaying data in the widget, change the aggregation function, and specify the grouping interval. To do this, open the Time window and make the necessary adjustments. Update the time window settings by clicking the “Update” button.
Step 3.4 Add an Alarms table widget
The alarms table widget displays alarms related to the specified entity in the certain time window. Alarm widget is configured by specifying an entity as the alarm source, and the corresponding alarm fields.
- Enter Edit mode.
- Click "Add new widget" icon in the bottom right corner of the screen.
- Click "Create new widget" icon.
- Specify the previously created device "My New Device" as the data source in the "Device" field. Next, we will configure the filters. All alarms have specific severities and statuses. Mark those you want to see in the widget. If none are marked, all alarms will be displayed regardless of their status or severity;
- Click "Add datasource" button.
- Select "MyDevice" Alias. Select "temperature" key. Click "Add".
- Drag and Drop you widget to desired space. Resize the widget. Apply changes.
- Publish different telemetry values multiple times Step 2. Note that the widget displays only one minute of data by default.
- Enter Edit mode. Open time selection window. Change the interval and aggregation function. Update the time window and apply changes.


Now it's time to configure alarm rules and raise some alarms.
Note: in this documentation, we are using a single device as a data source for the widgets. To use dynamic entities (for example, devices of a certain type or related to a certain asset) as data source, you should use the alias. Alias is a reference to a single entity or a group of entities that are used in the widgets. You may learn more about different aliases here.
Step 4. Configure alarm rules
We'll use the alarm rules feature to define a rule that triggers an alarm when the temperature exceeds 25 °C. Alarm rules are configured in the device profile used by the target device.
In our example, “My new device” uses the “default” device profile. While it's best practice to create separate profiles for each device type, we'll skip that step here for simplicity.
- Navigate to the device profiles page.
- Click the default profile row. This will open device profile details.
- Select the "Alarm Rules" tab and toggle edit mode.
- Click "Add alarm rule".
- Specify alarm type and click the "+" icon to add alarm rule condition.
- Click the "Add key filter" button to specify a condition.
- Select key type, input key name, select value type, and click "Add".
- Select operation and input threshold value. Click "Add".
- Click "Save".
- Finally, click "Apply changes".


Step 5. Create alarm
Now, our alarm rule is active (see Step 4), and we should send new telemetry on behalf of the device (see Step 2) to trigger the alarm.
Note that the temperature value should be 26 or higher to raise the alarm. Once we send a new temperature reading, we should immediately see a new alarm on our dashboard.
- Notice that the new temperature telemetry causes a new active alarm.
- User may acknowledge and clear the alarms.


We also recommend reviewing alarm rule examples and documentation about alarm notifications.
Step 6. Alarm notifications
The IoT Hub Notification center allows personalized notifications to end-users regarding device activities, environmental changes, or events in your IoT ecosystem, and more. Notifications can be delivered via email, SMS, or integrated third-party systems.
Enjoy exploring IoT Hub!
Step 7. Share dashboard with customers
One of the most important IoT Hub features is the ability to create end-user dashboards. Each Customer User should see his own devices and should not be able to see devices or any other data that belongs to a different customer.
We have already created the Device (see Step 1), the Dashboard and added widgets to it (see Step 3). Now it's time to create a Customer and a Customer User and make sure they will have access to the device's data and the dashboard. There are two options for how Tenant Administrator can give access to a certain Entity (Device, Dashboard, Asset, etc.) for a Customer:
- A. Assign the Customer as the owner of the entity. This option is useful to ensure that only this customer can access the device and its data (see Step 7.2).
- B. Share the entity with the Customer. This option is useful to share a single dashboard with multiple customers (see Step 7.3).
Step 7.1 Create a customer
Let's create a customer with the title “My New Customer”. Please see the instructions below:
- Navigate to the customer groups page.
- Then navigate to the default customer group "All".
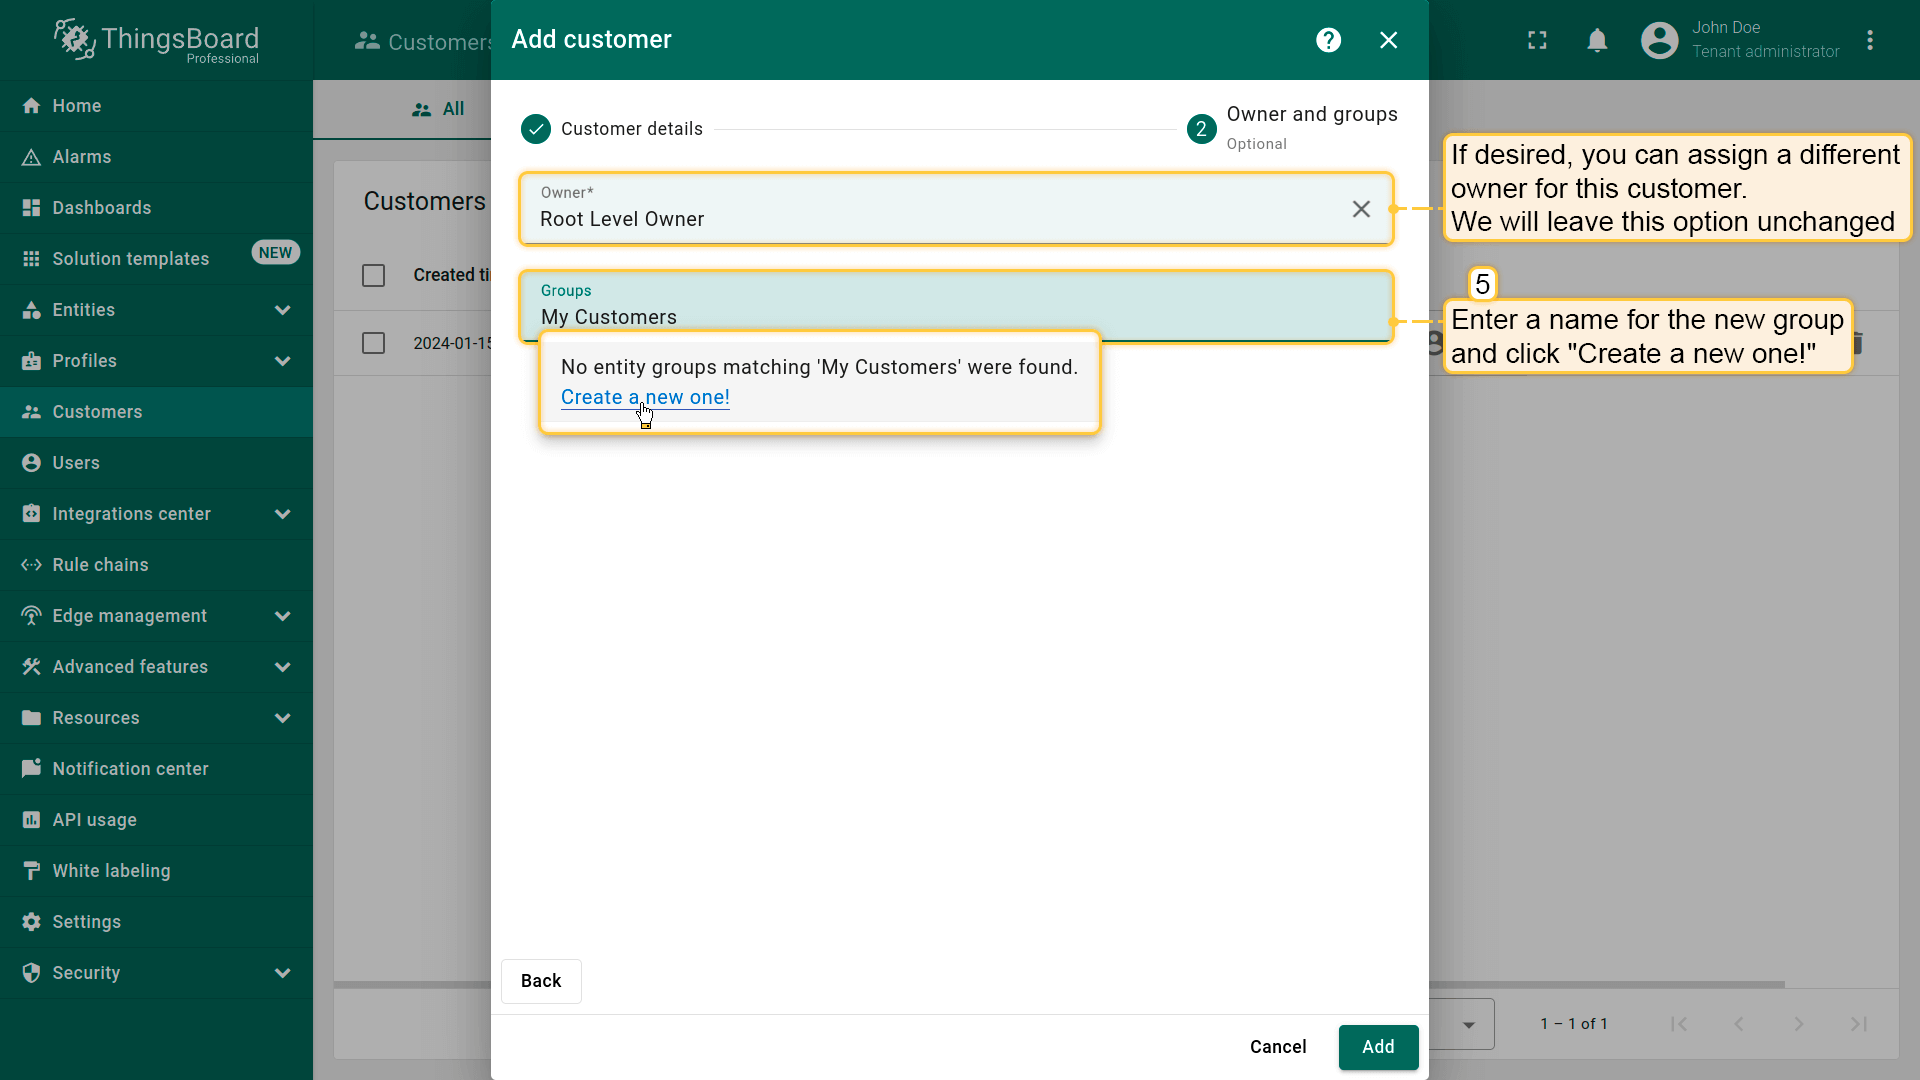
- If needed, you can assign a different owner for this customer. We will leave this option unchanged. Enter a name for the new group and click "Create a new one!";
- Add customer title and click "Add".


Step 7.2 Change owner of the device
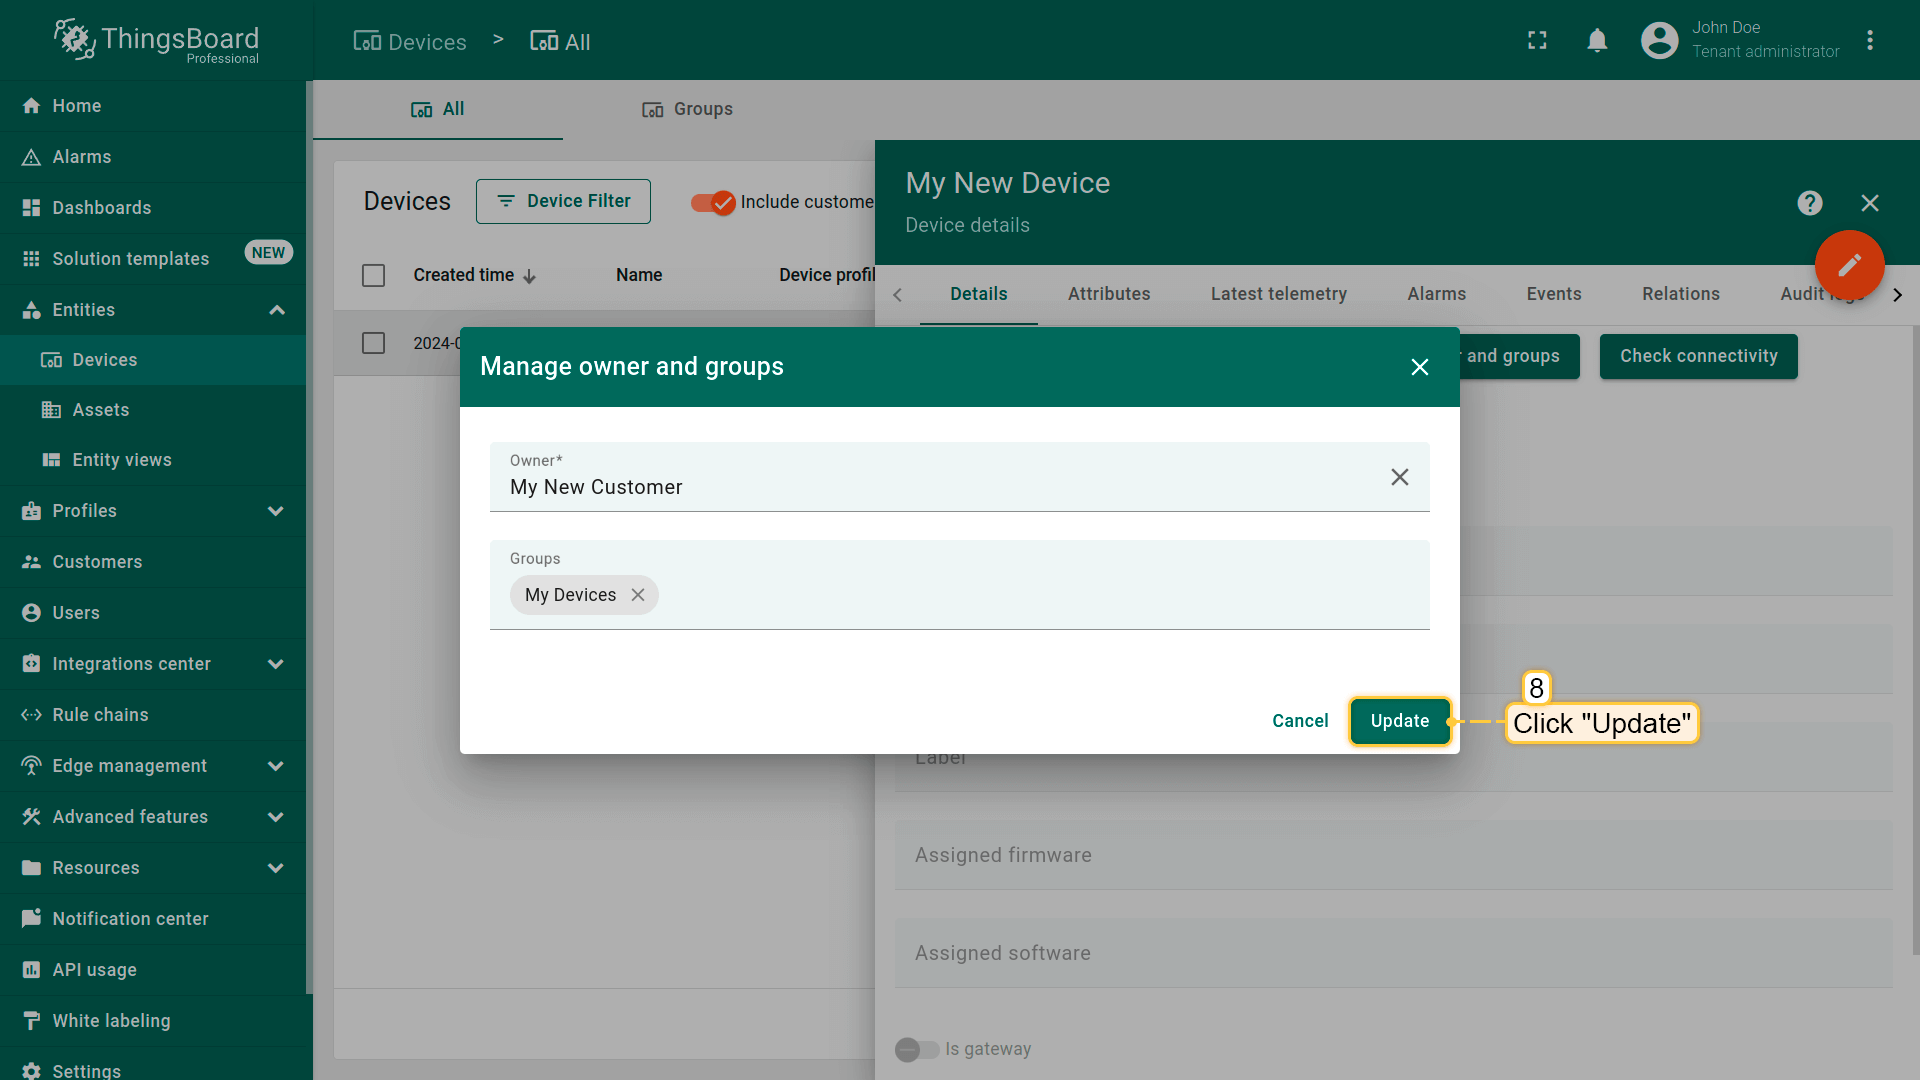
Let's assign the Customer as the owner of the device. We will also create a group of devices and add our device to this group.
- Select your device and click the "Change Owner" button.
- Start typing the customer name and then click on the customer item.
- Click the "Change owner" button.
- Click "Yes". You can always change the owner back to the tenant.
- Your device list should be empty now. This is because it displays the devices of the tenant. Navigate to the customer hierarchy to see your device.
- Click "Update" to add to the group and change the owner of your device. You can always change the owner back to the tenant;
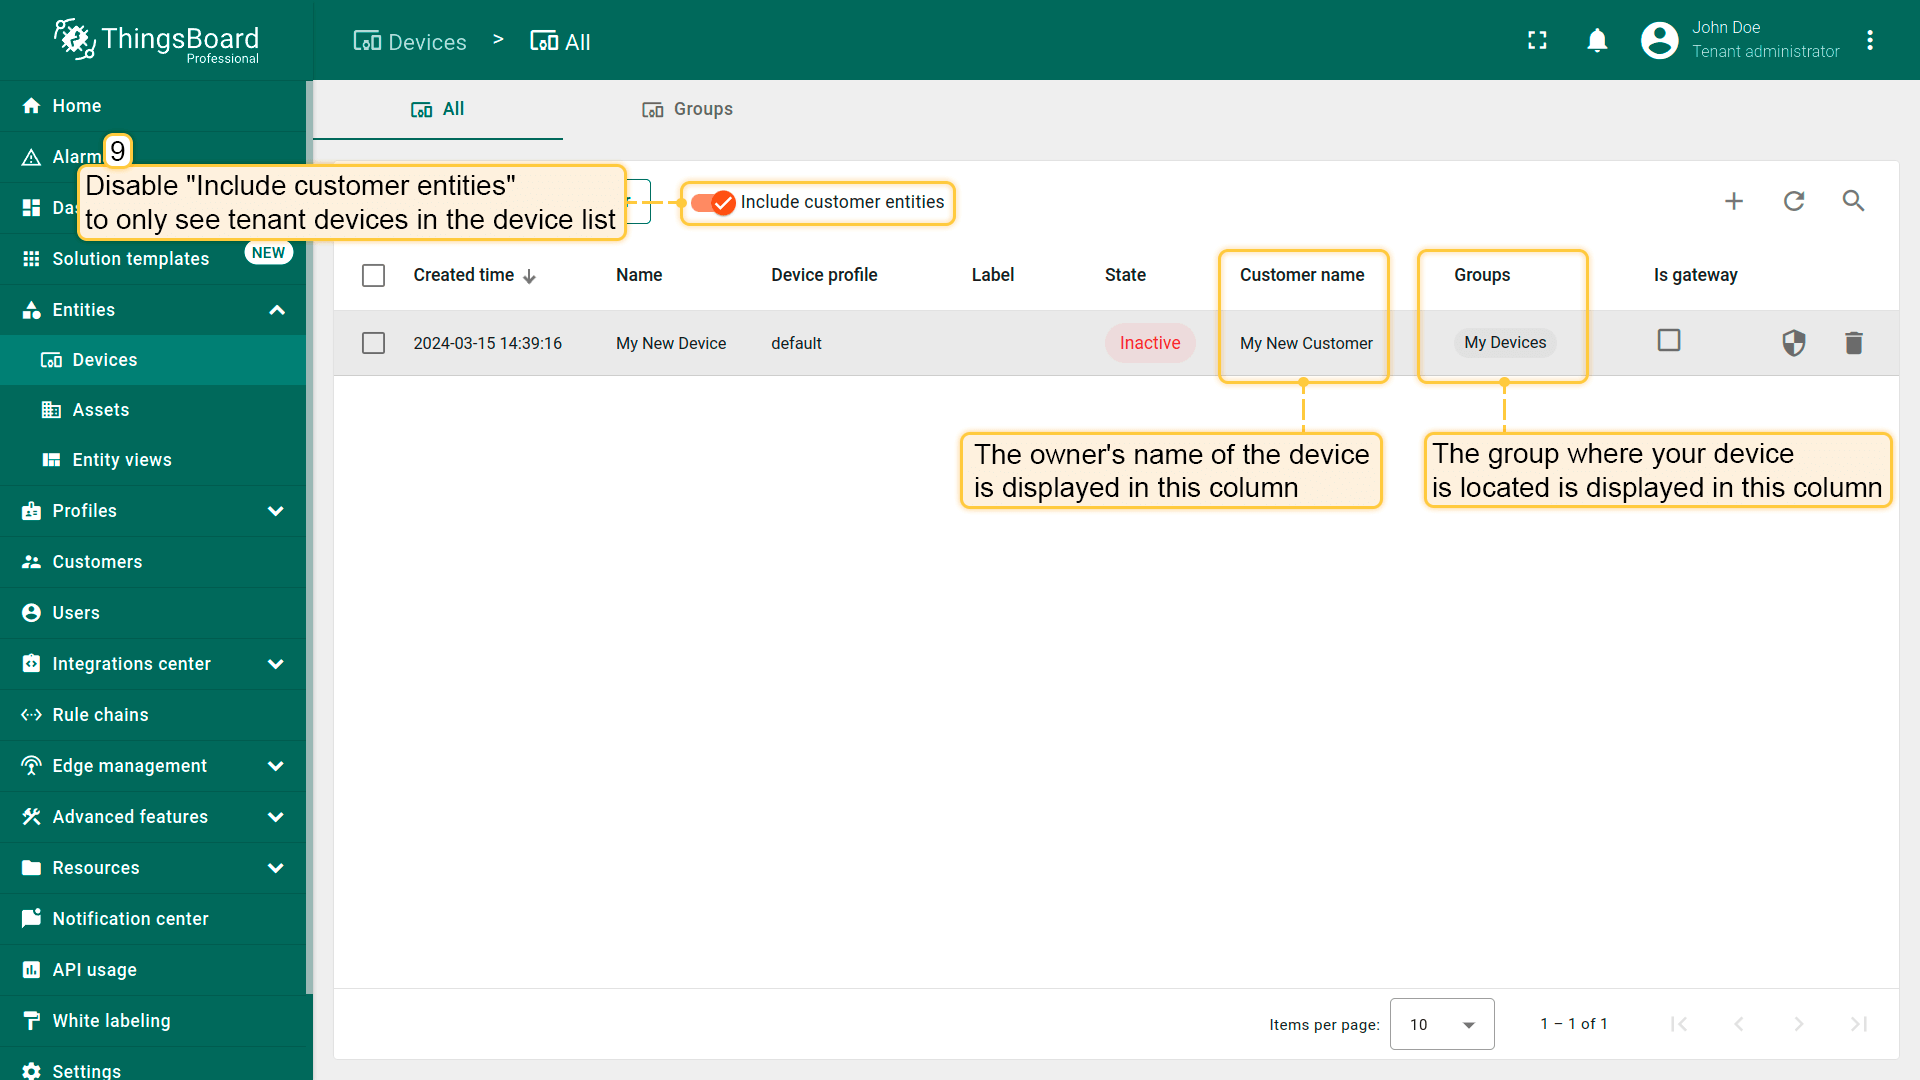
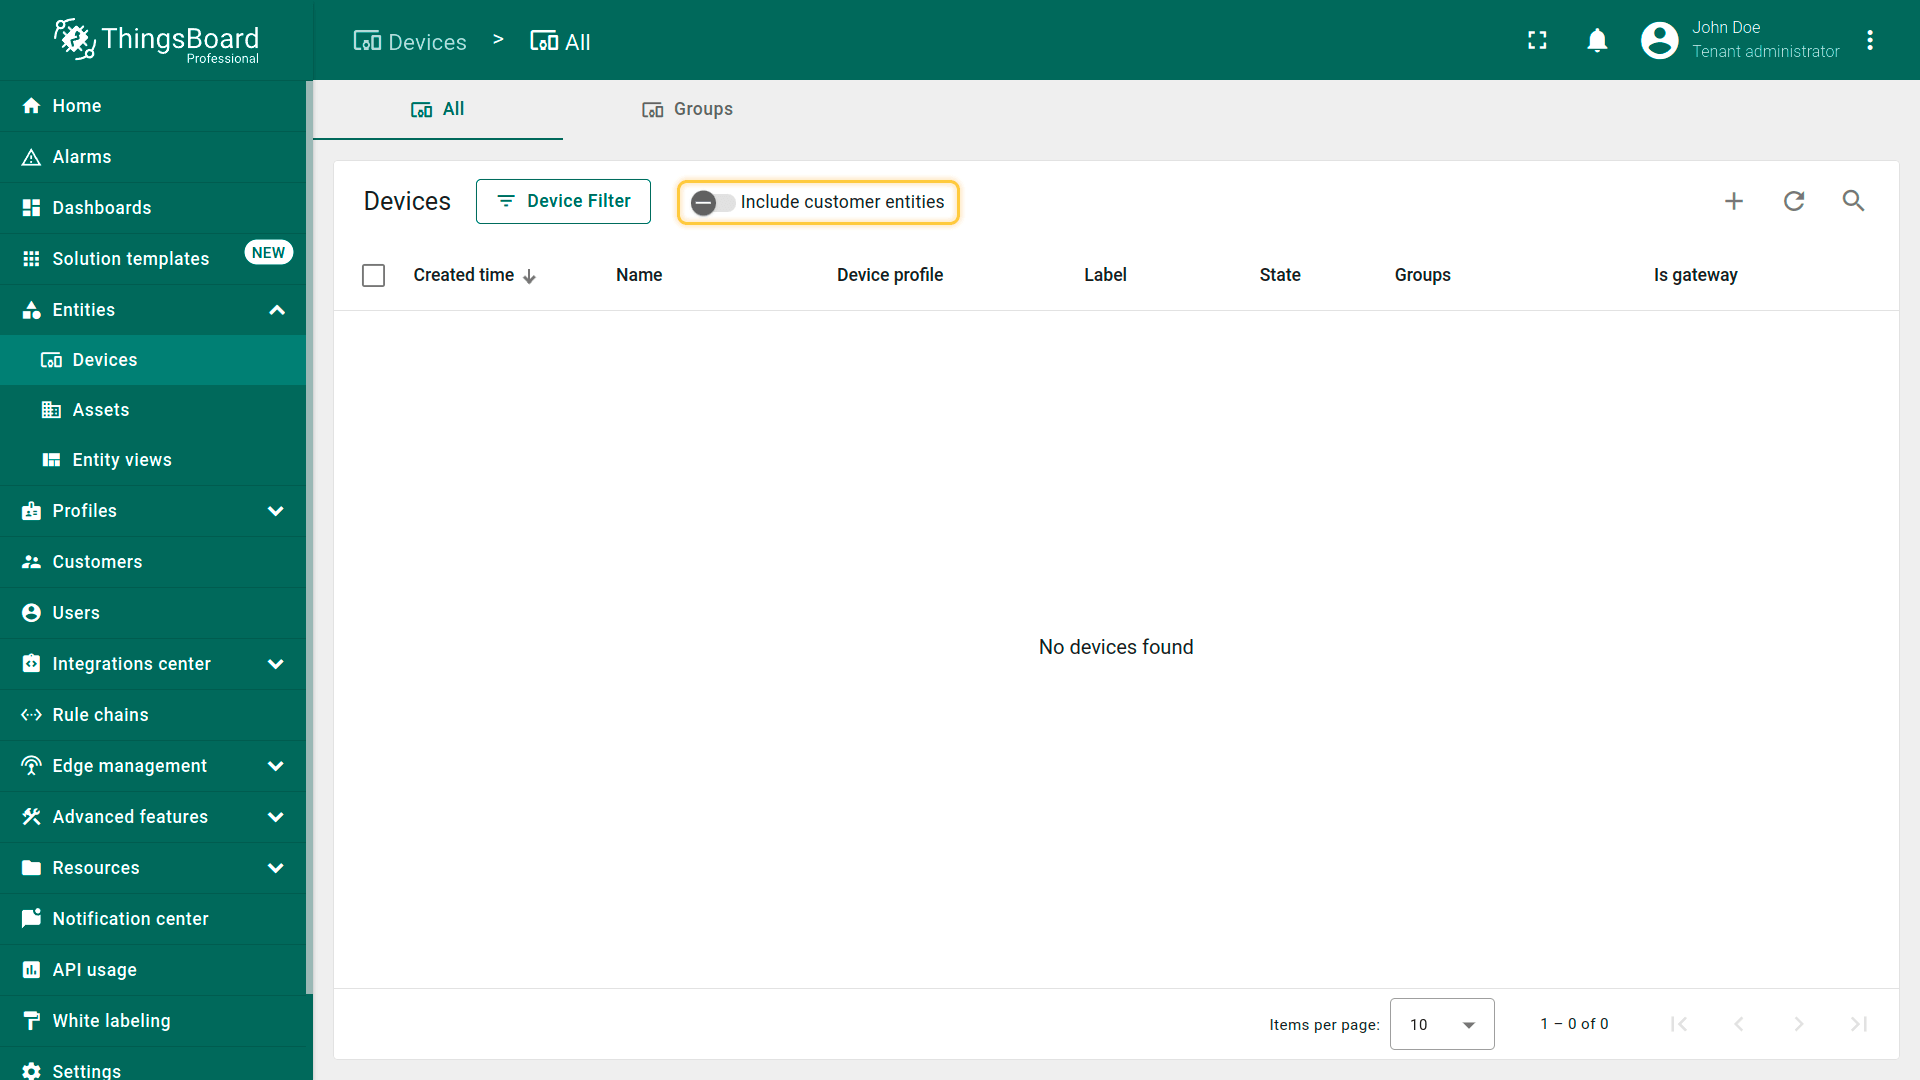
- By default, the general device list displays both tenant devices and devices of your customers. Disable "Include customer entities" to only see tenant devices in the device list;
- Your device list should be empty now.


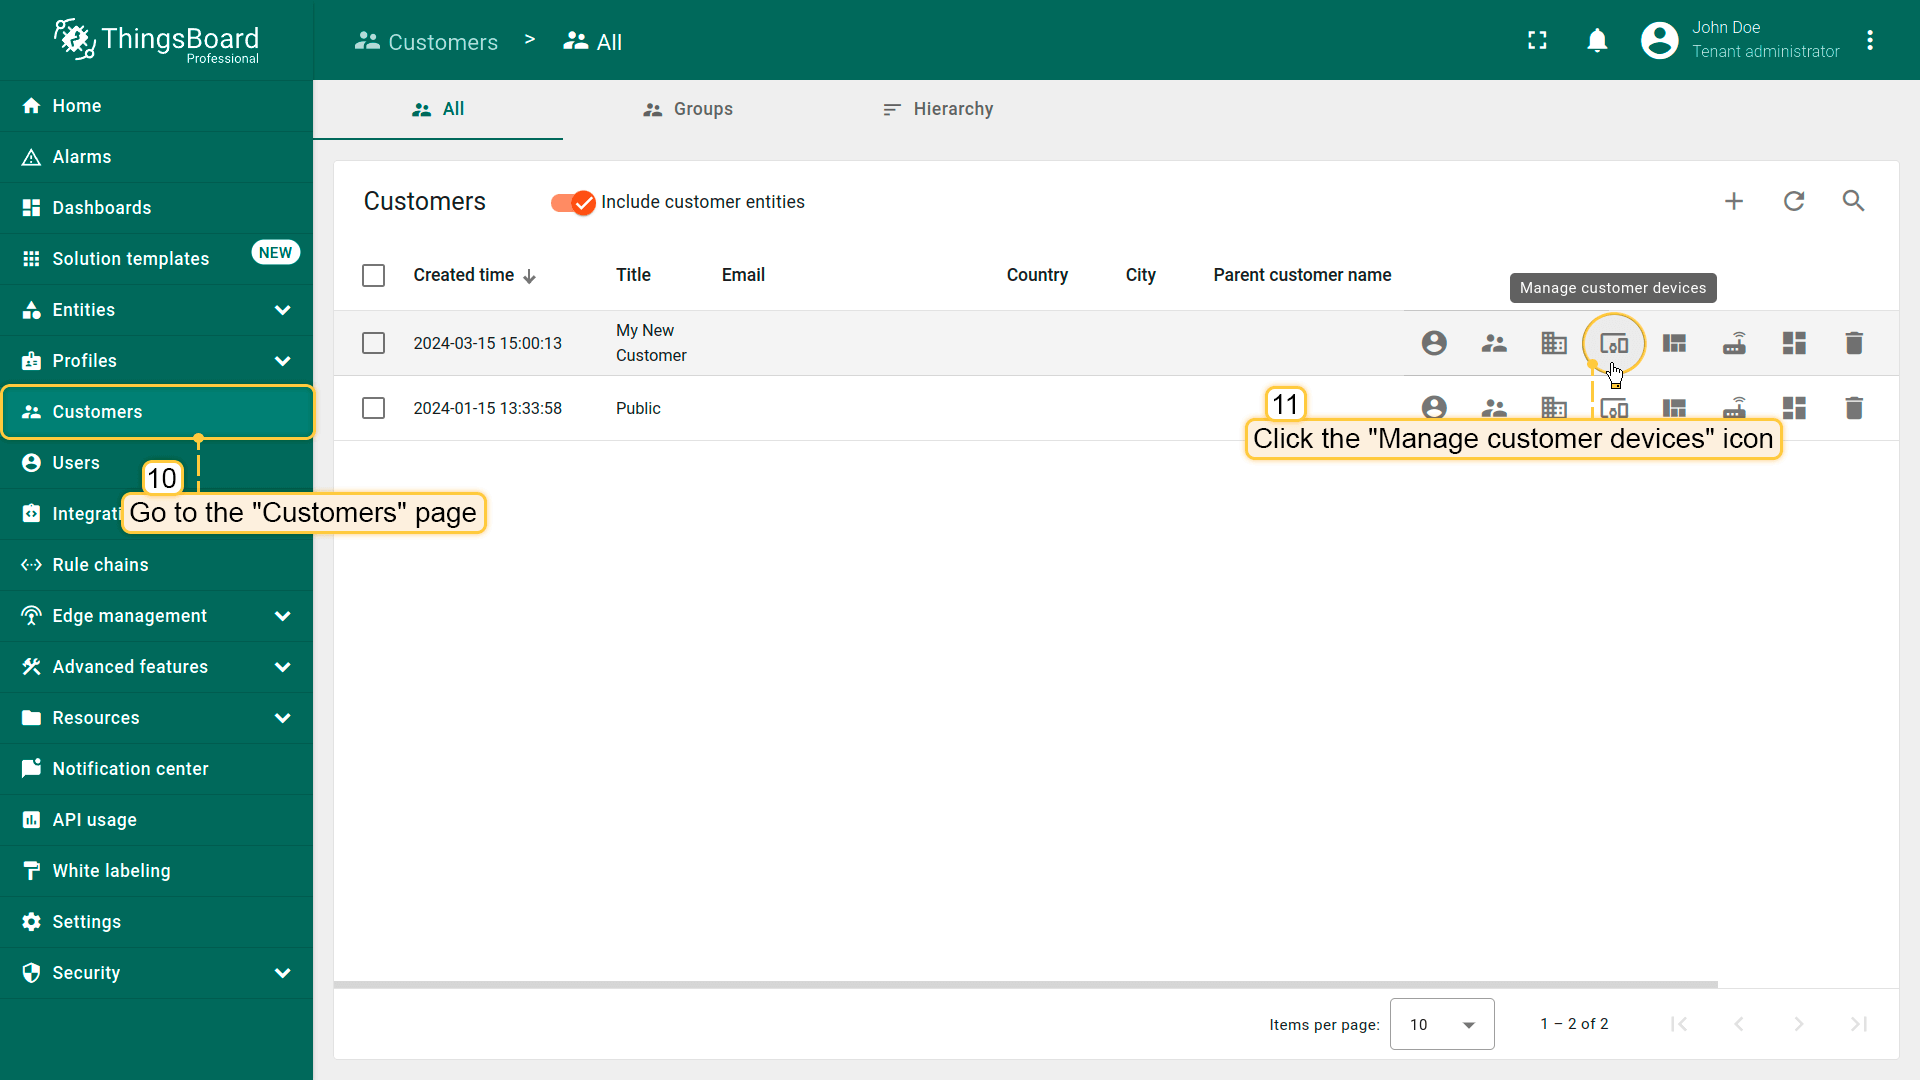
Make sure that the device is assigned to your customer.
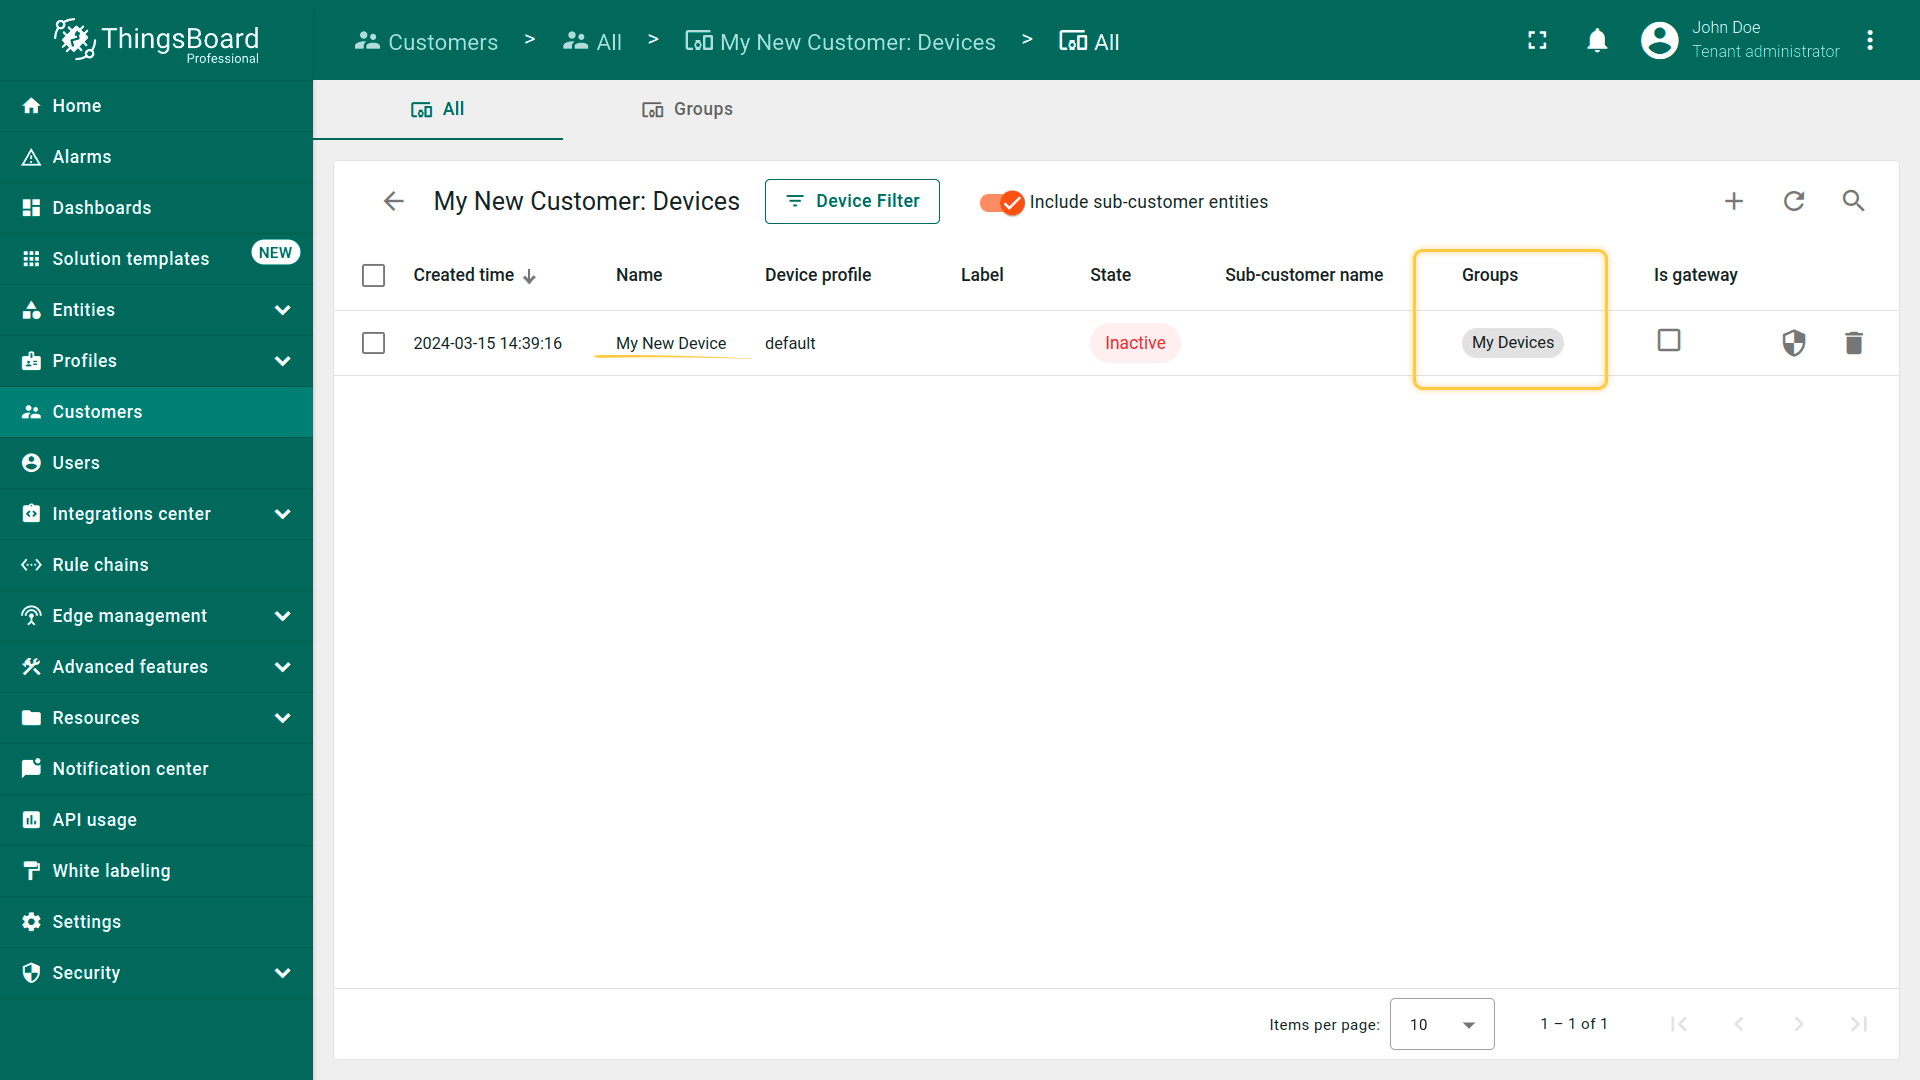
- Navigate to "Customers" page. Find your customer in the list of customers and then click on the "Manage customer devices" icon;
- Your device is owned by the customer and is located in the customer's device group "My Devices".
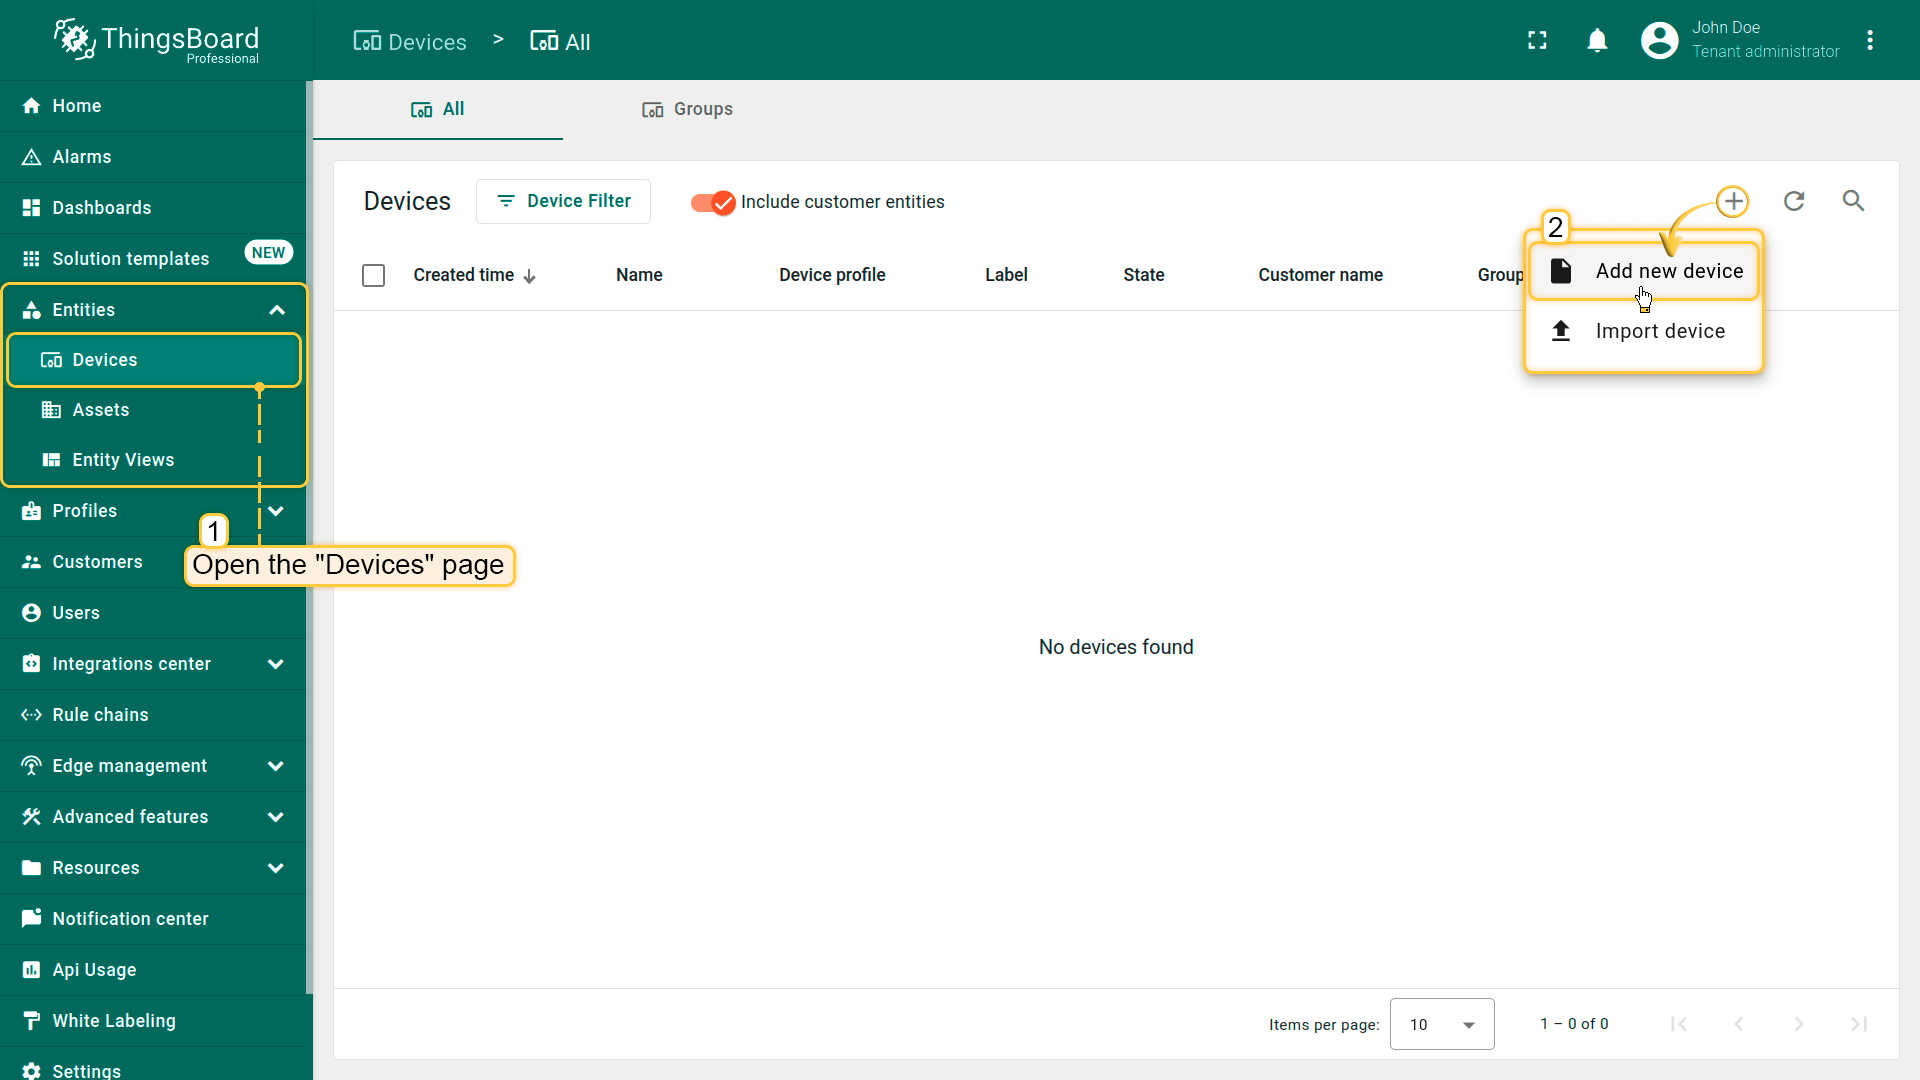
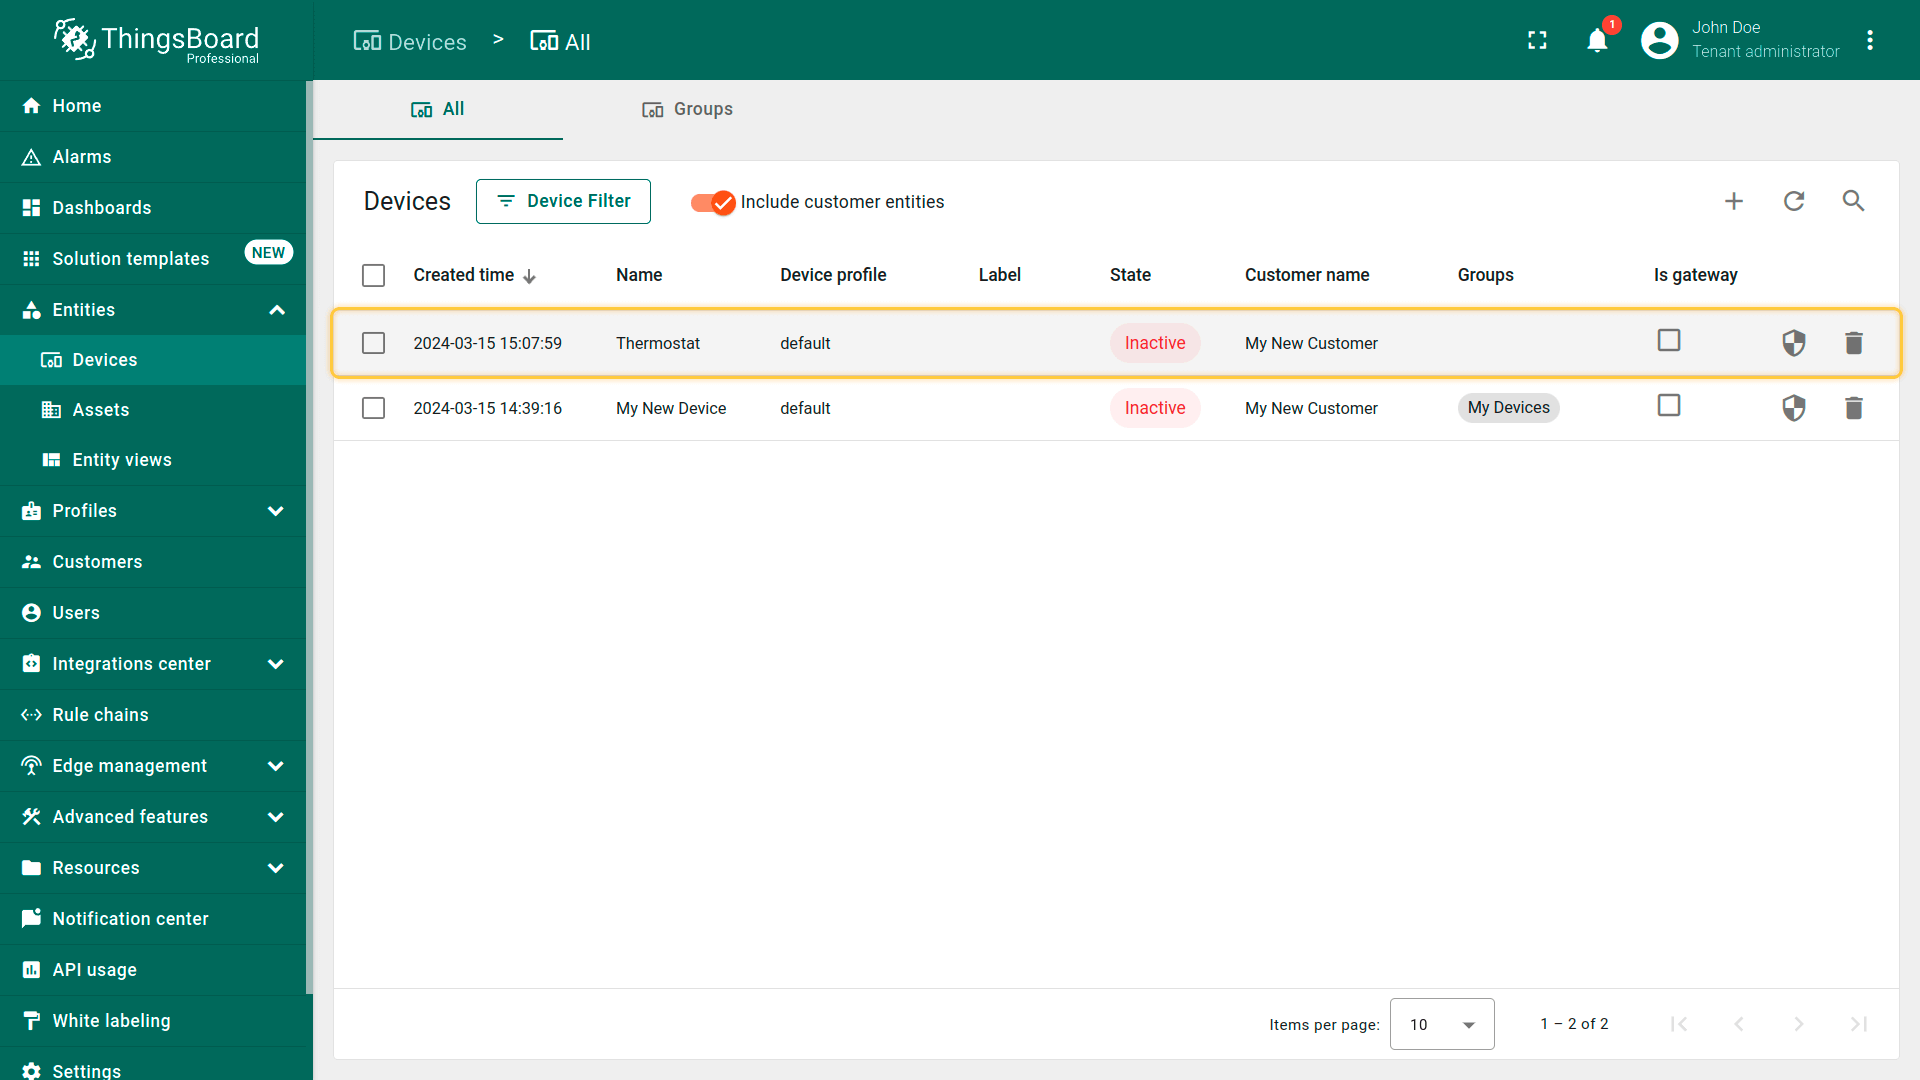
You can make the customer the owner of the device during its creation stage. To do this, follow this steps:
- Open the "Devices" page. Click on the "+" icon in the top right corner of the table and then select "Add new device" from drop-down menu;
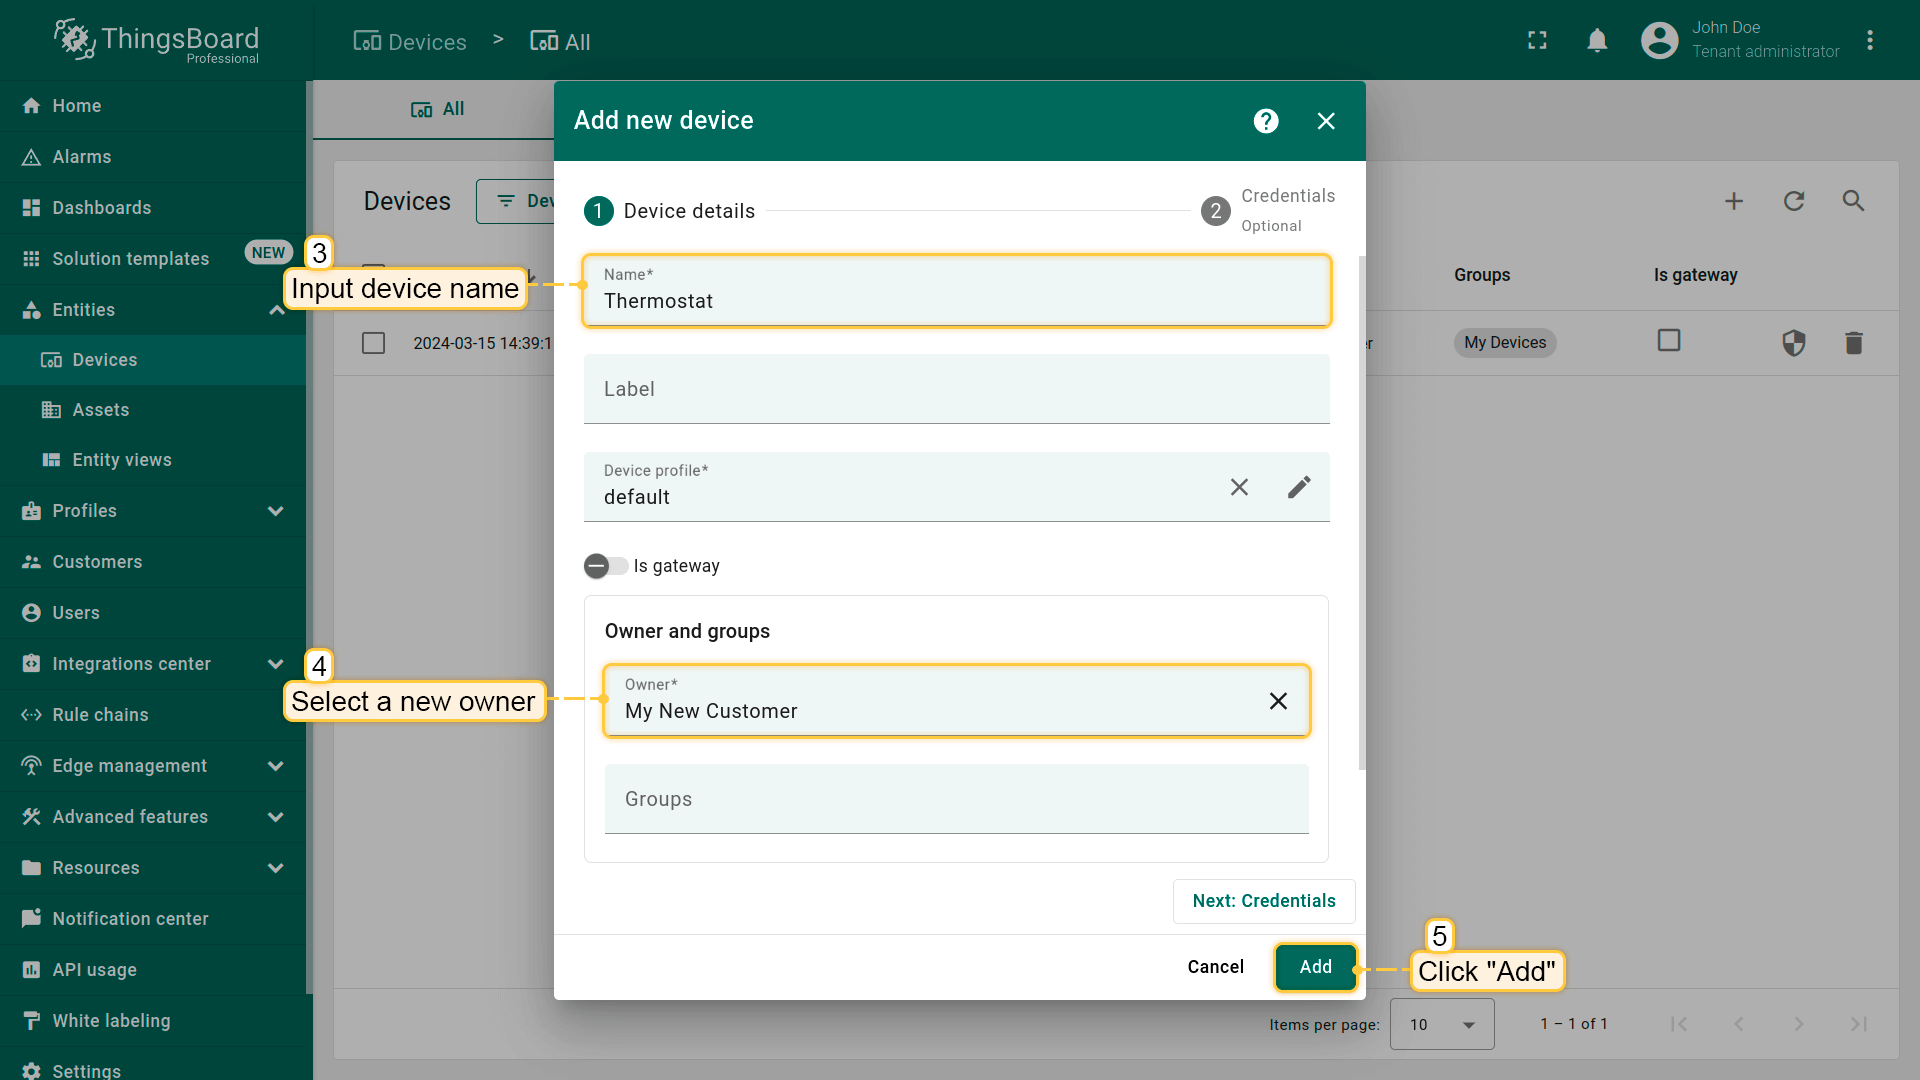
- Input device name (for example, "Thermostat") and select the new owner in the "Owner" field. Then, click "Add";
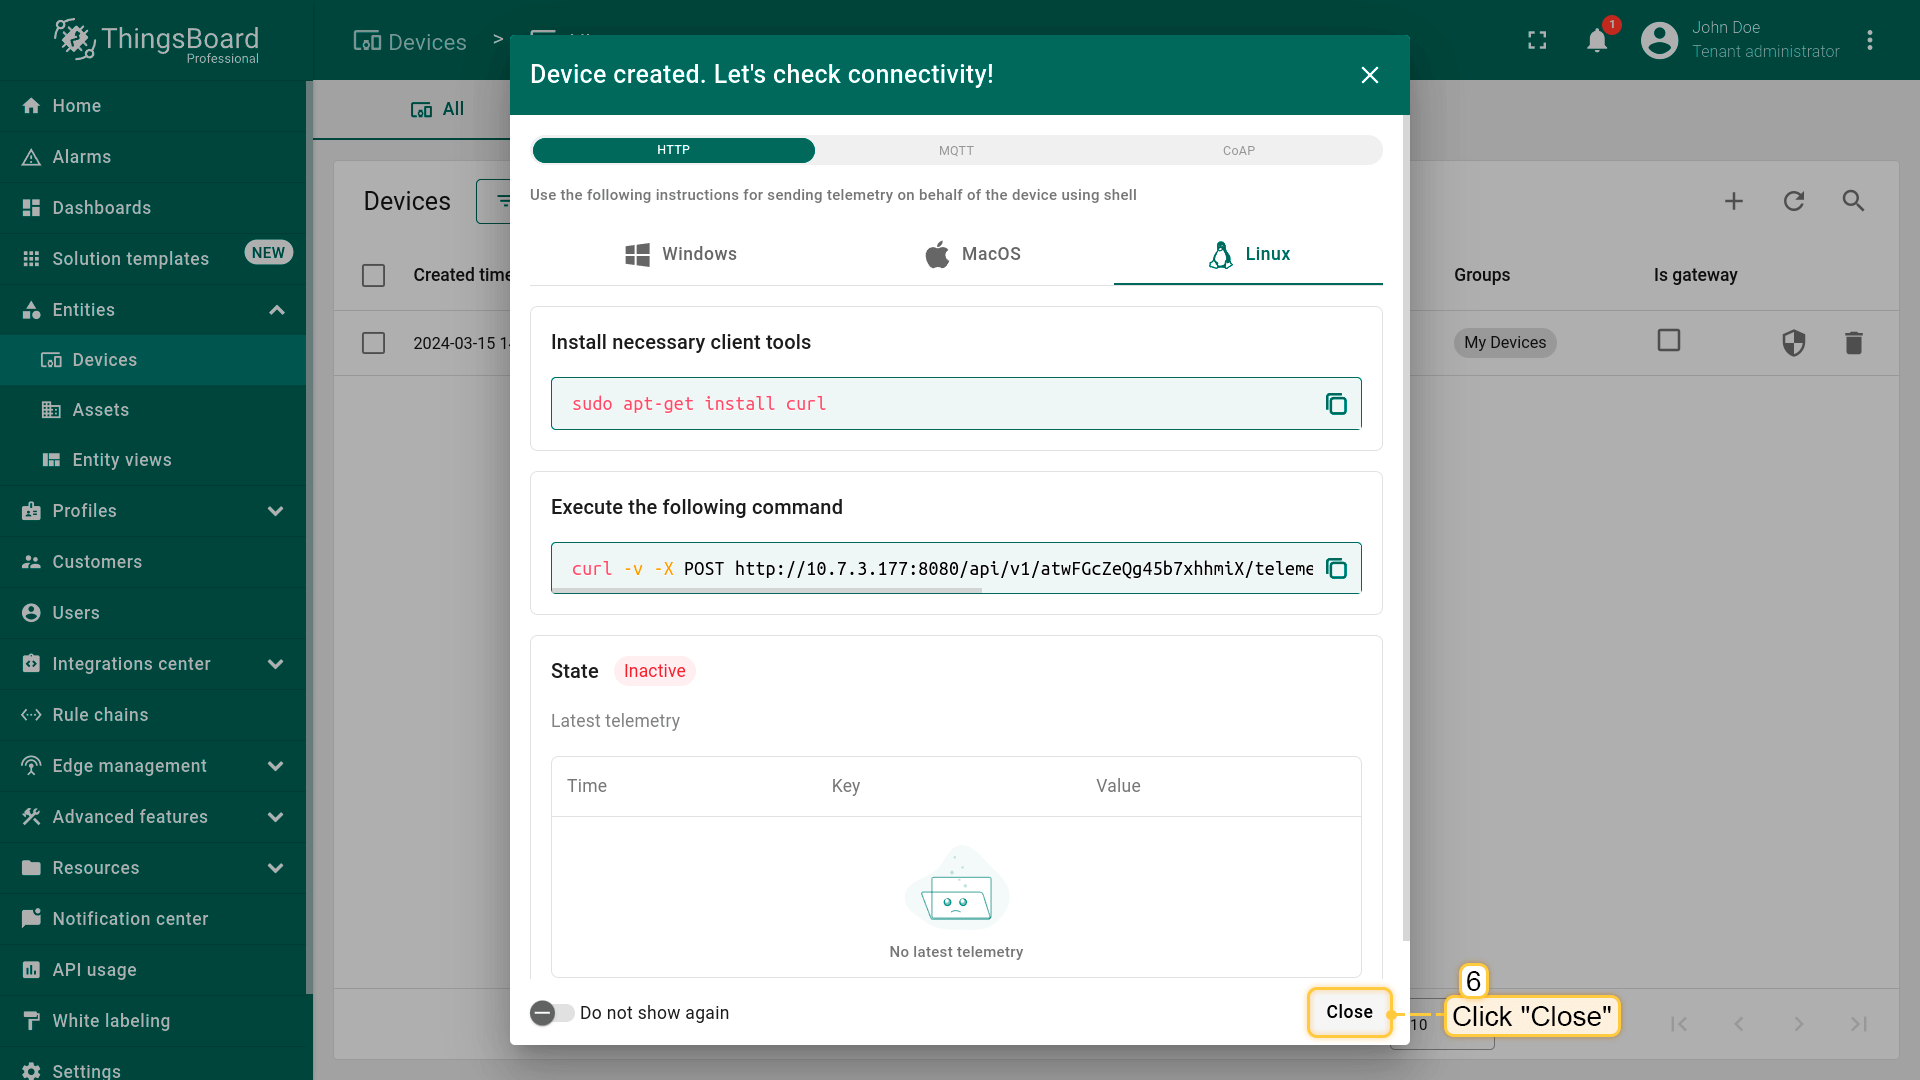
- Close check connectivity window;
- The device has been created, and it immediately belongs to your customer.
Step 7.3 Share the dashboard
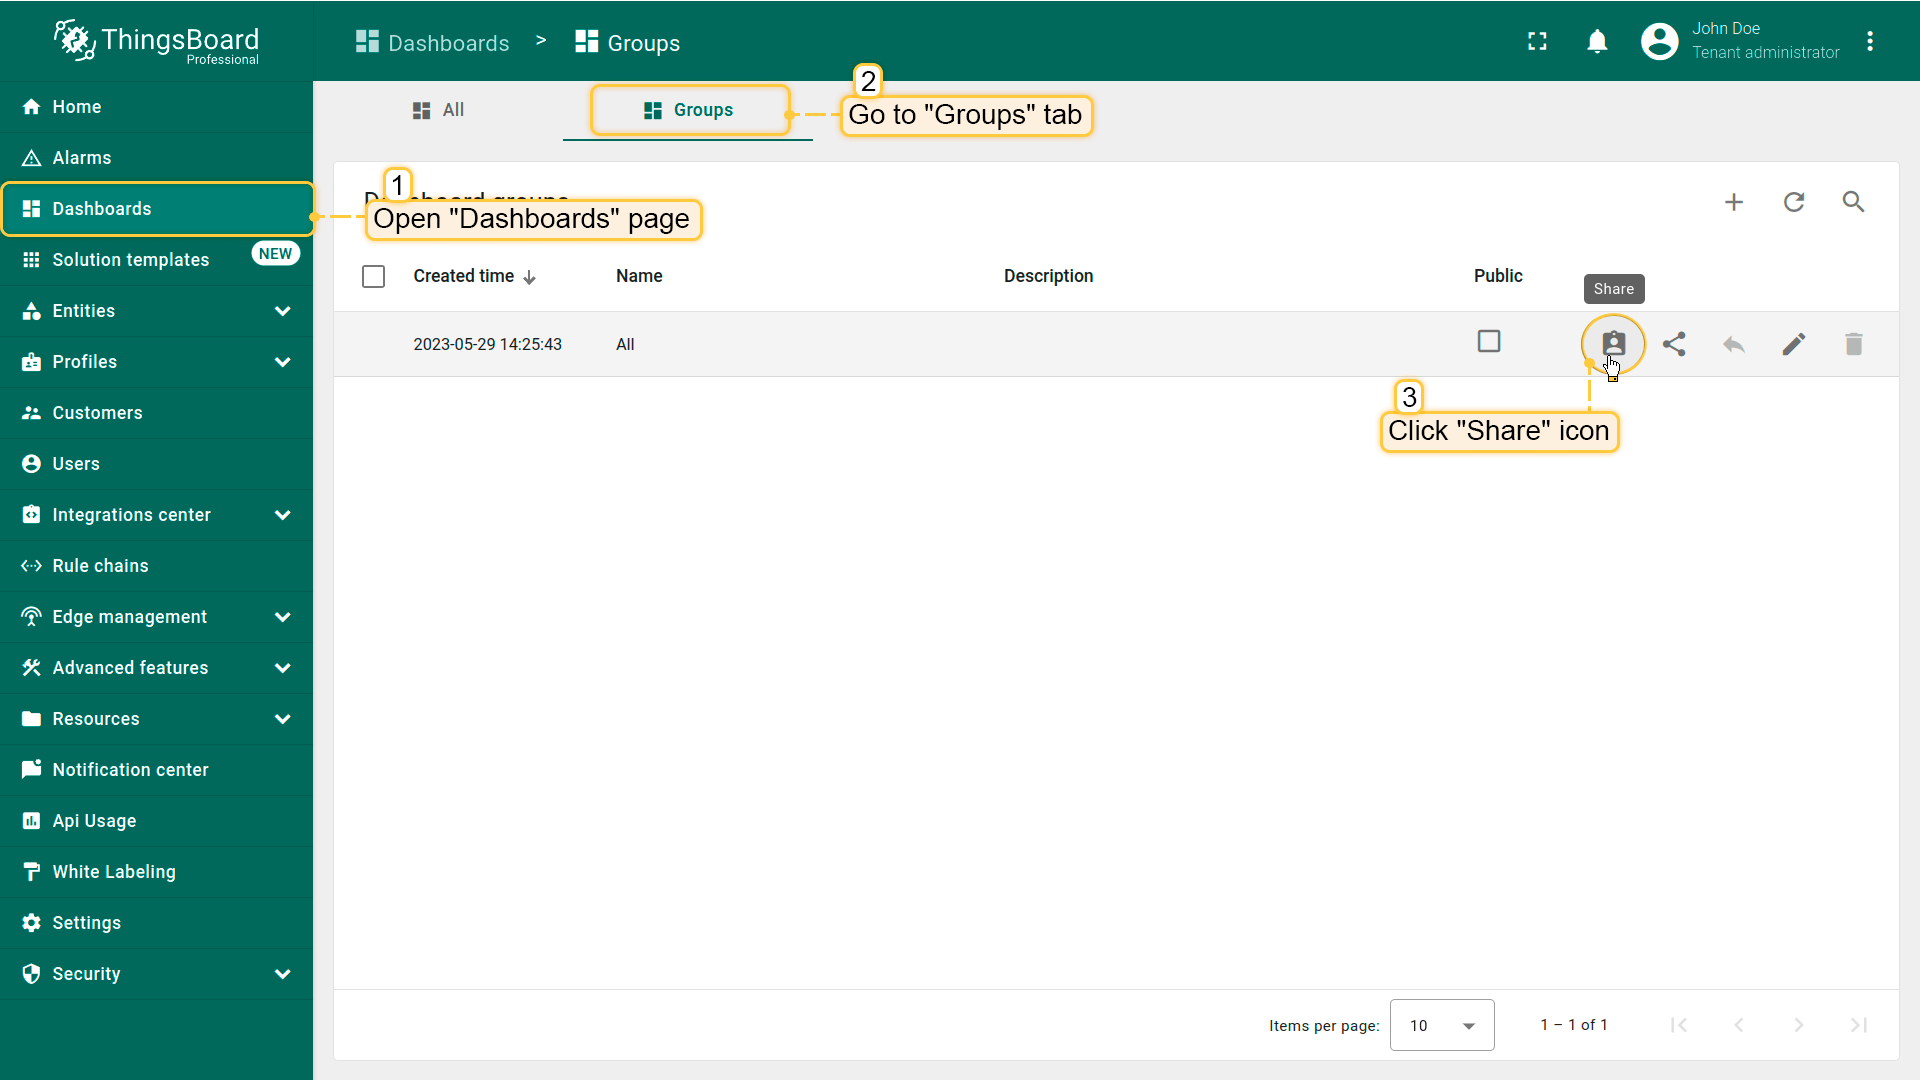
Let's share our dashboard with the customer. In IoT Hub, you can't share an individual dashboard directly — you can only share a dashboard group that contains the dashboard you want to share. By default, your dashboard is located in the “All” group. While the recommended approach is to create a dedicated dashboard group and move your dashboard there, for simplicity, we'll use the existing “All” group in this guide.
- Open the "Dashboards" page and go to the "Groups" tab. Click the "Share" icon next to the "All" dashboard group;
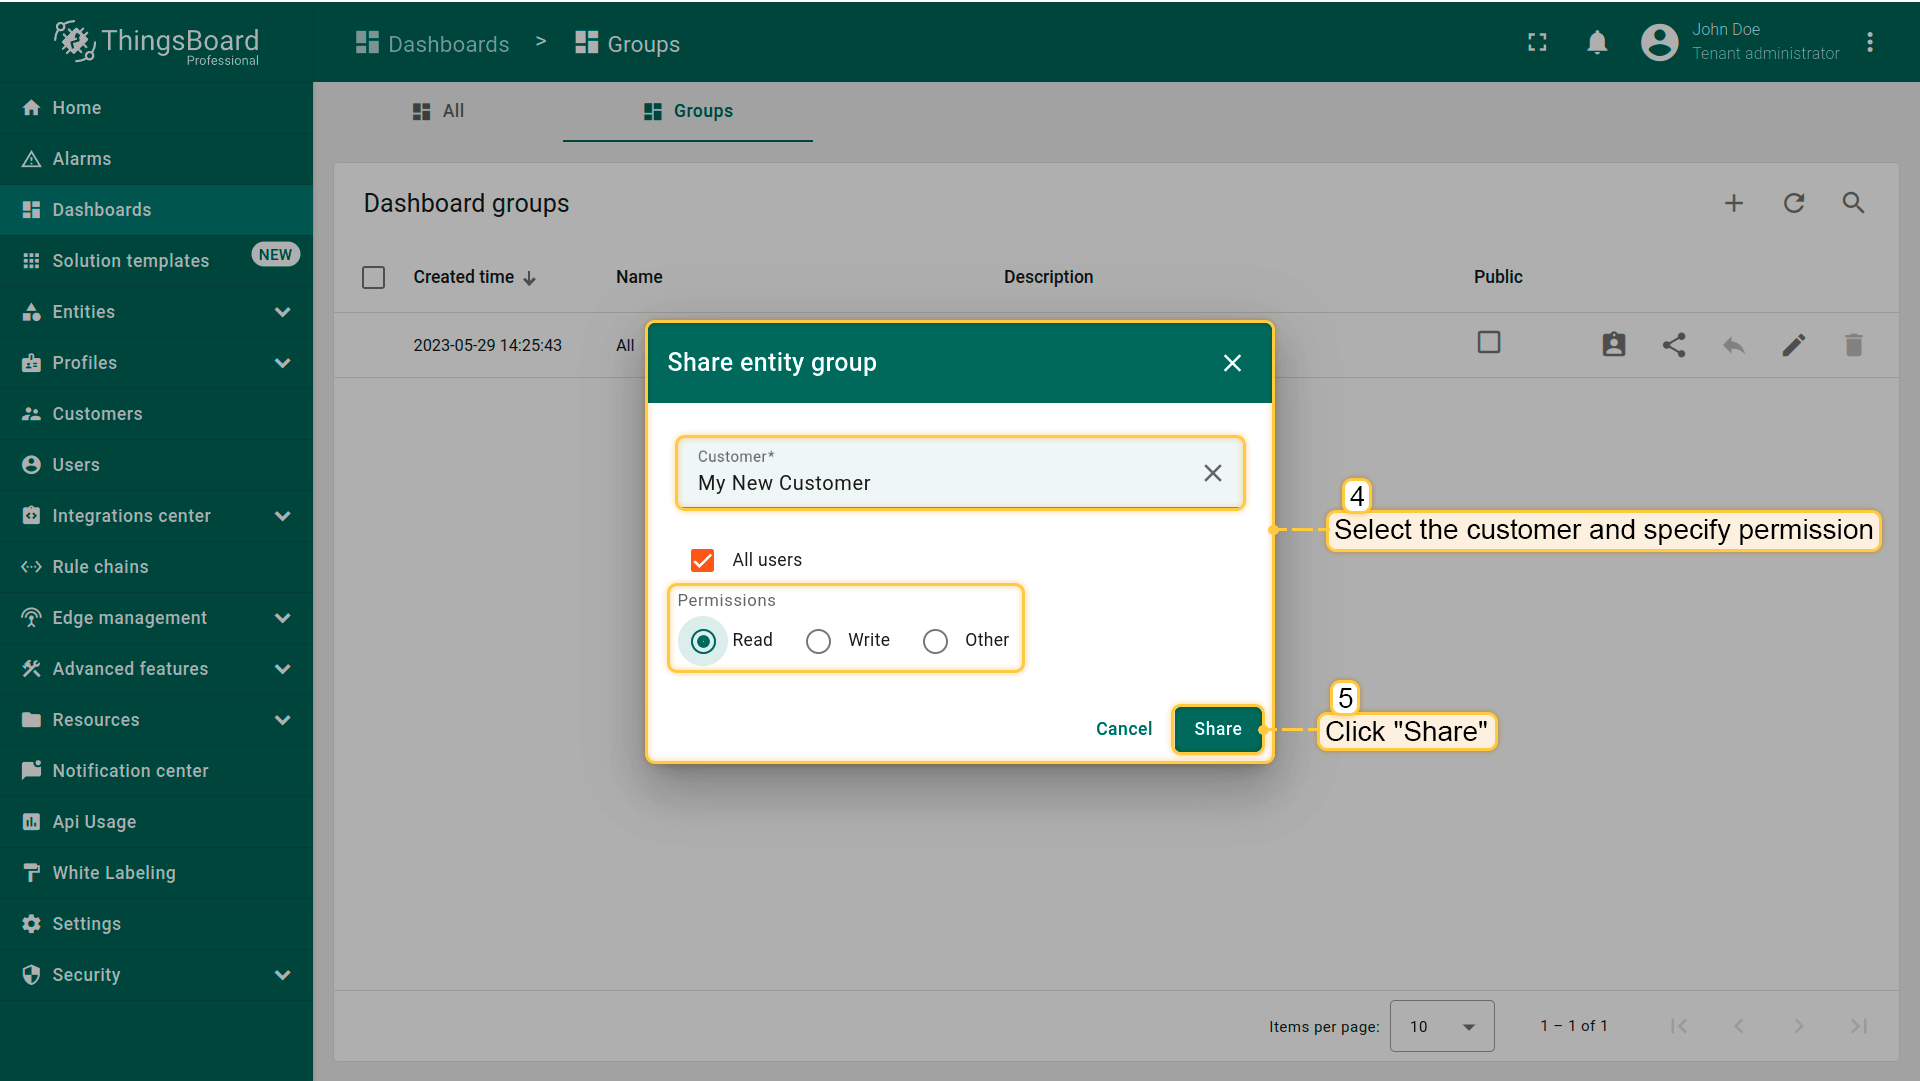
- Select the customer you want to share the dashboard with and set the permission level. In this case, choose "Read", then click "Share".
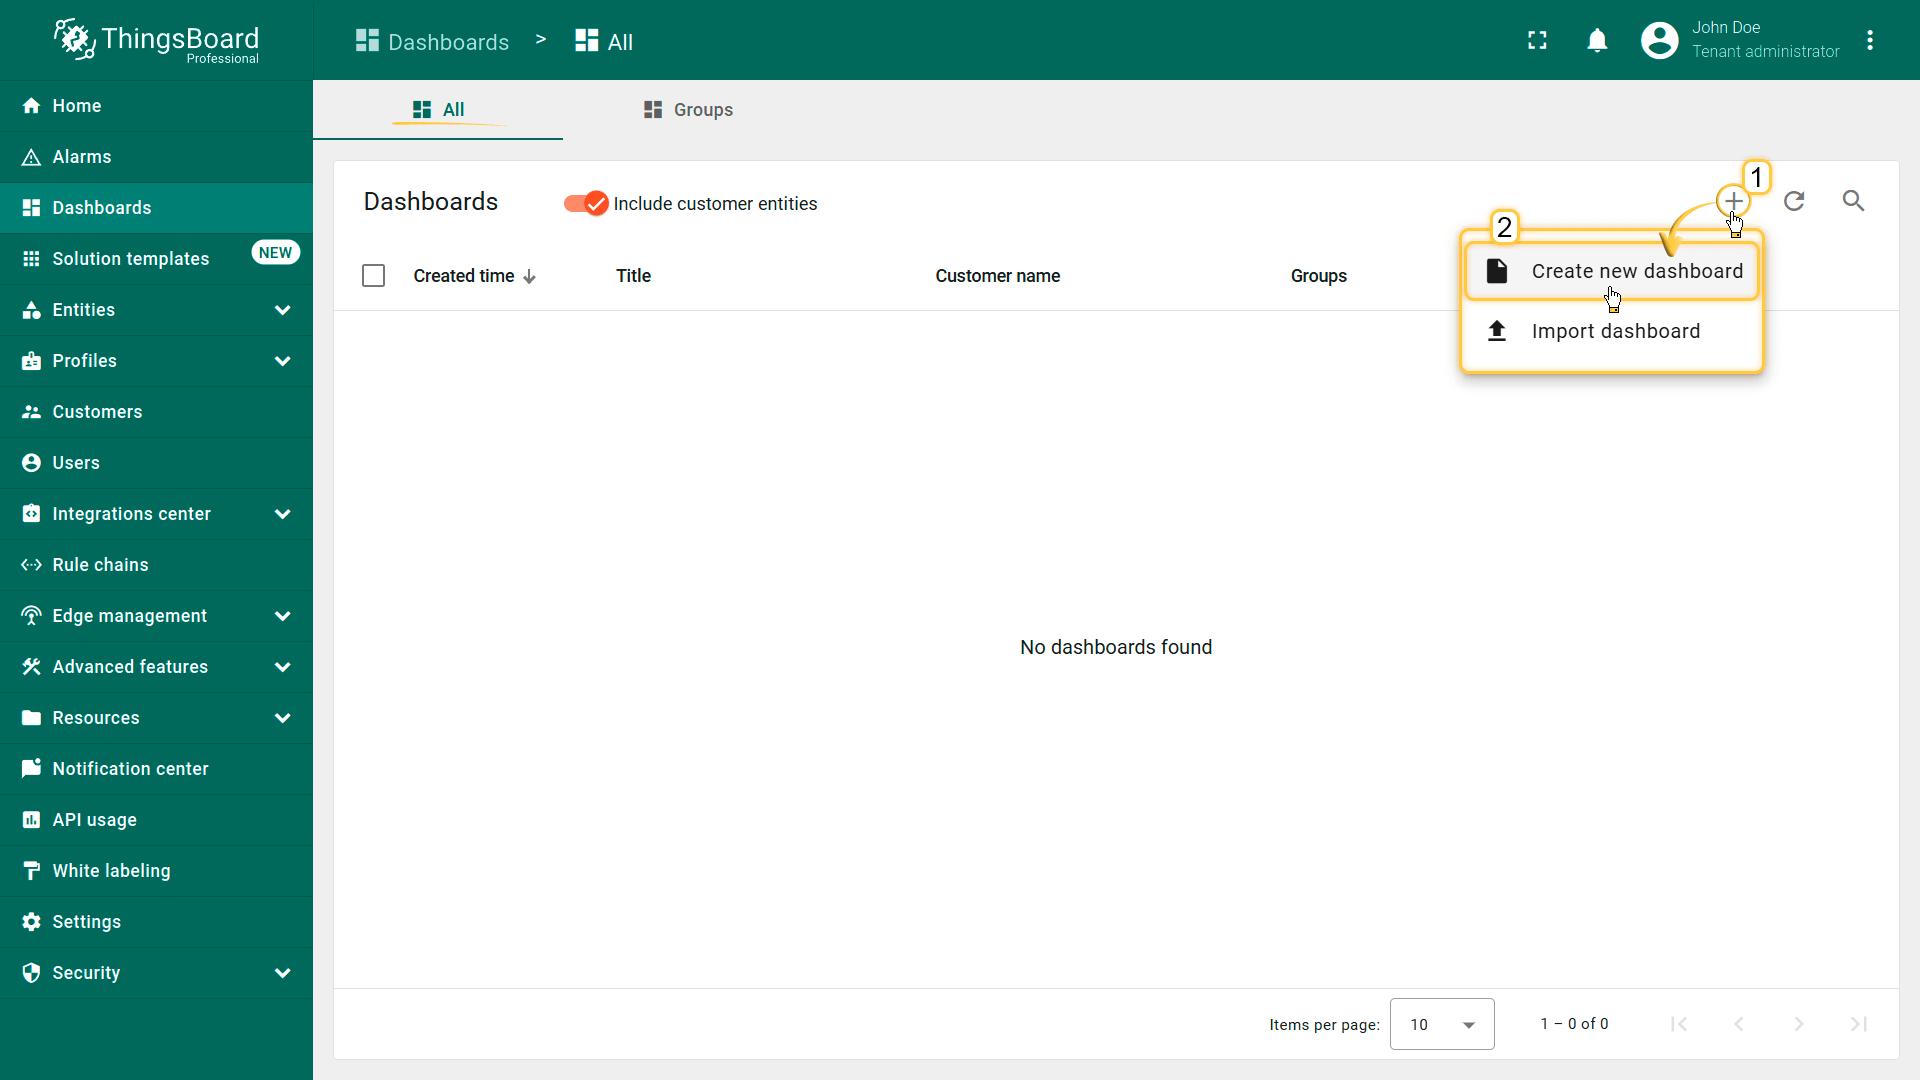
You can also share the dashboard with a customer during its creation:
- On the "All" tab of the "Dashboards" page, click on the "+" icon in the top right corner of the table and select "Create new dashboard" from the drop-down menu;
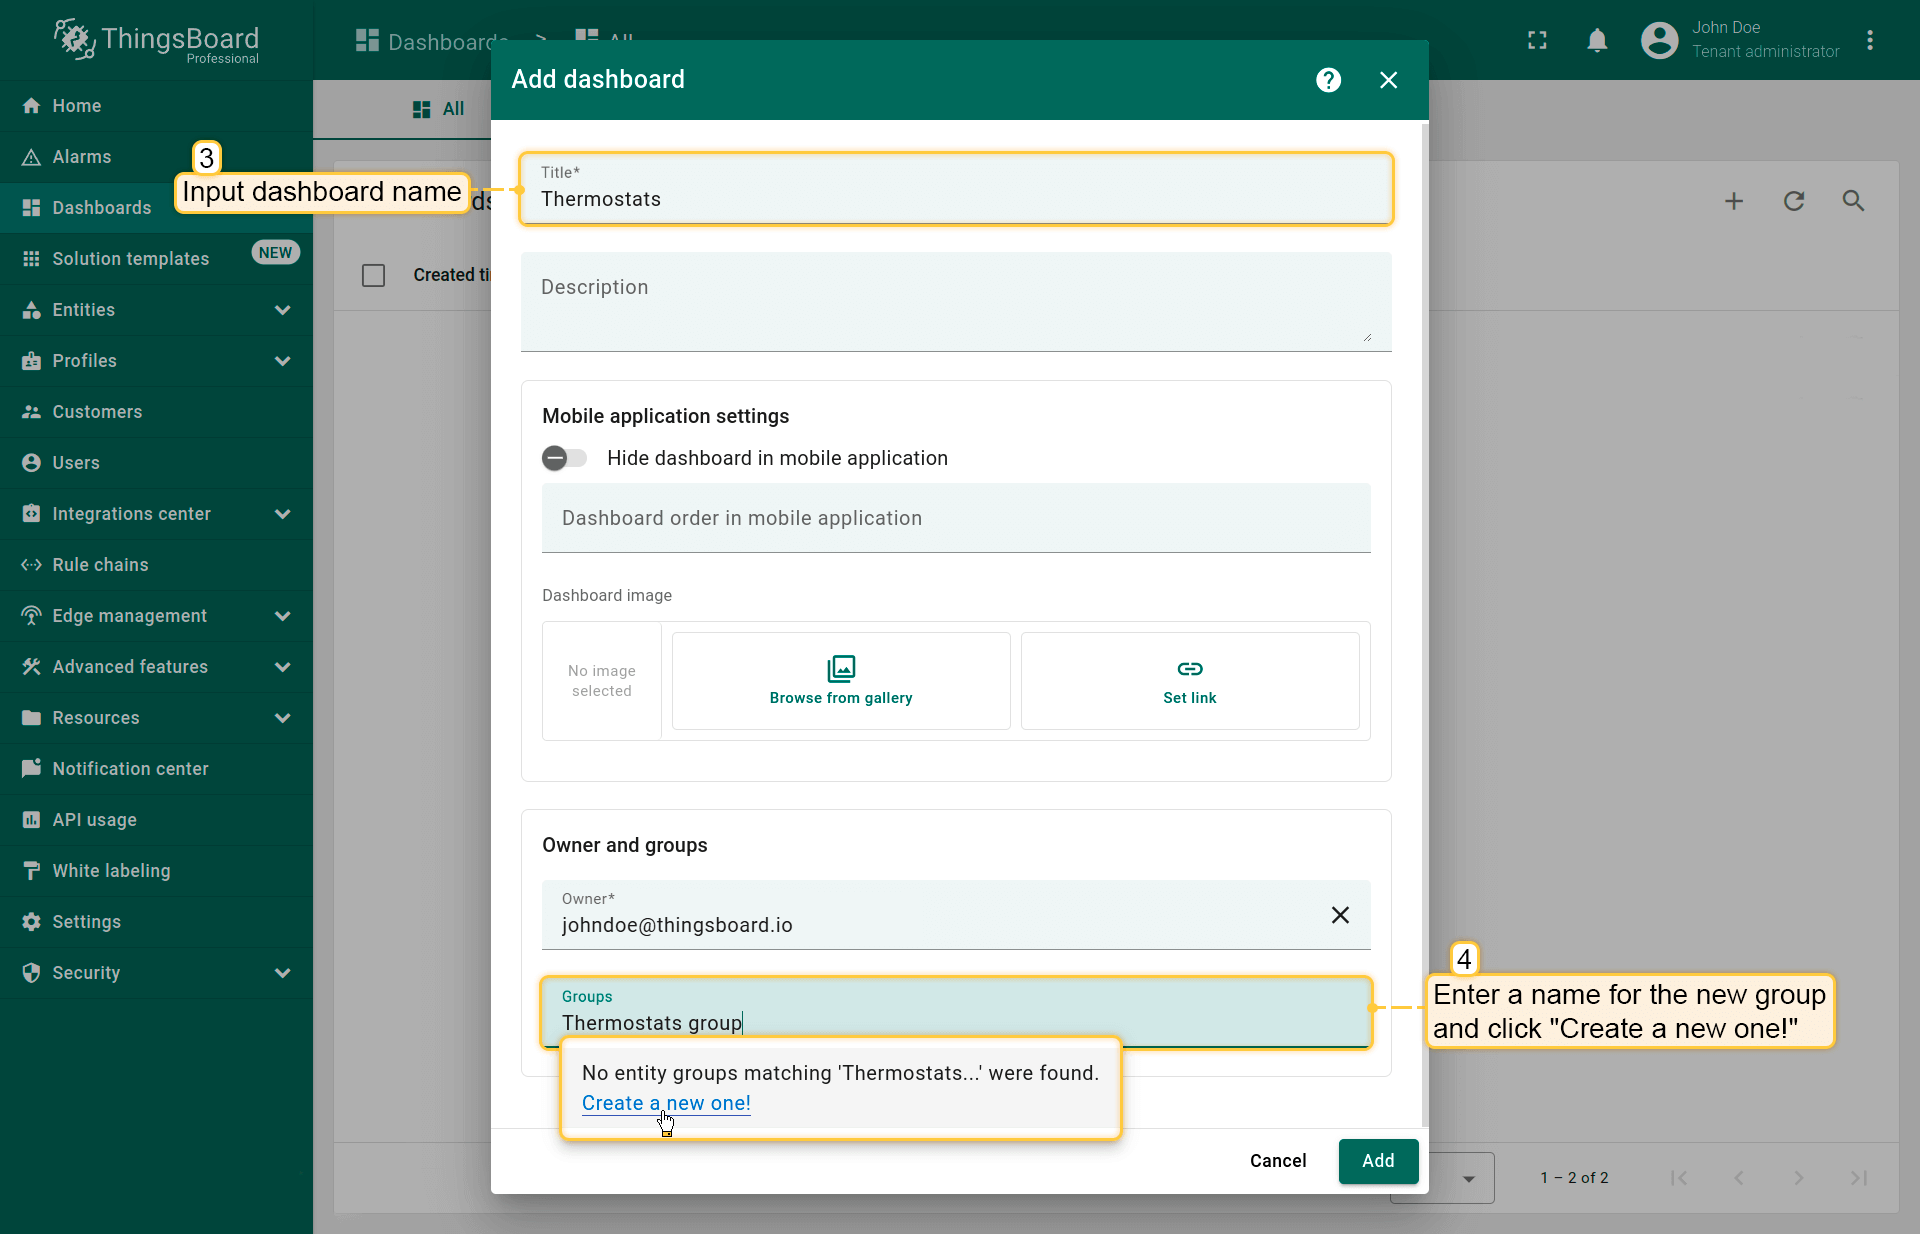
- Enter a name for the dashboard (e.g., "Thermostats"). In the "Groups" field of the "Owner and groups" section, select an existing group or enter a name for a new dashboard group (for example, "Thermostats group") and click "Create a new one!";
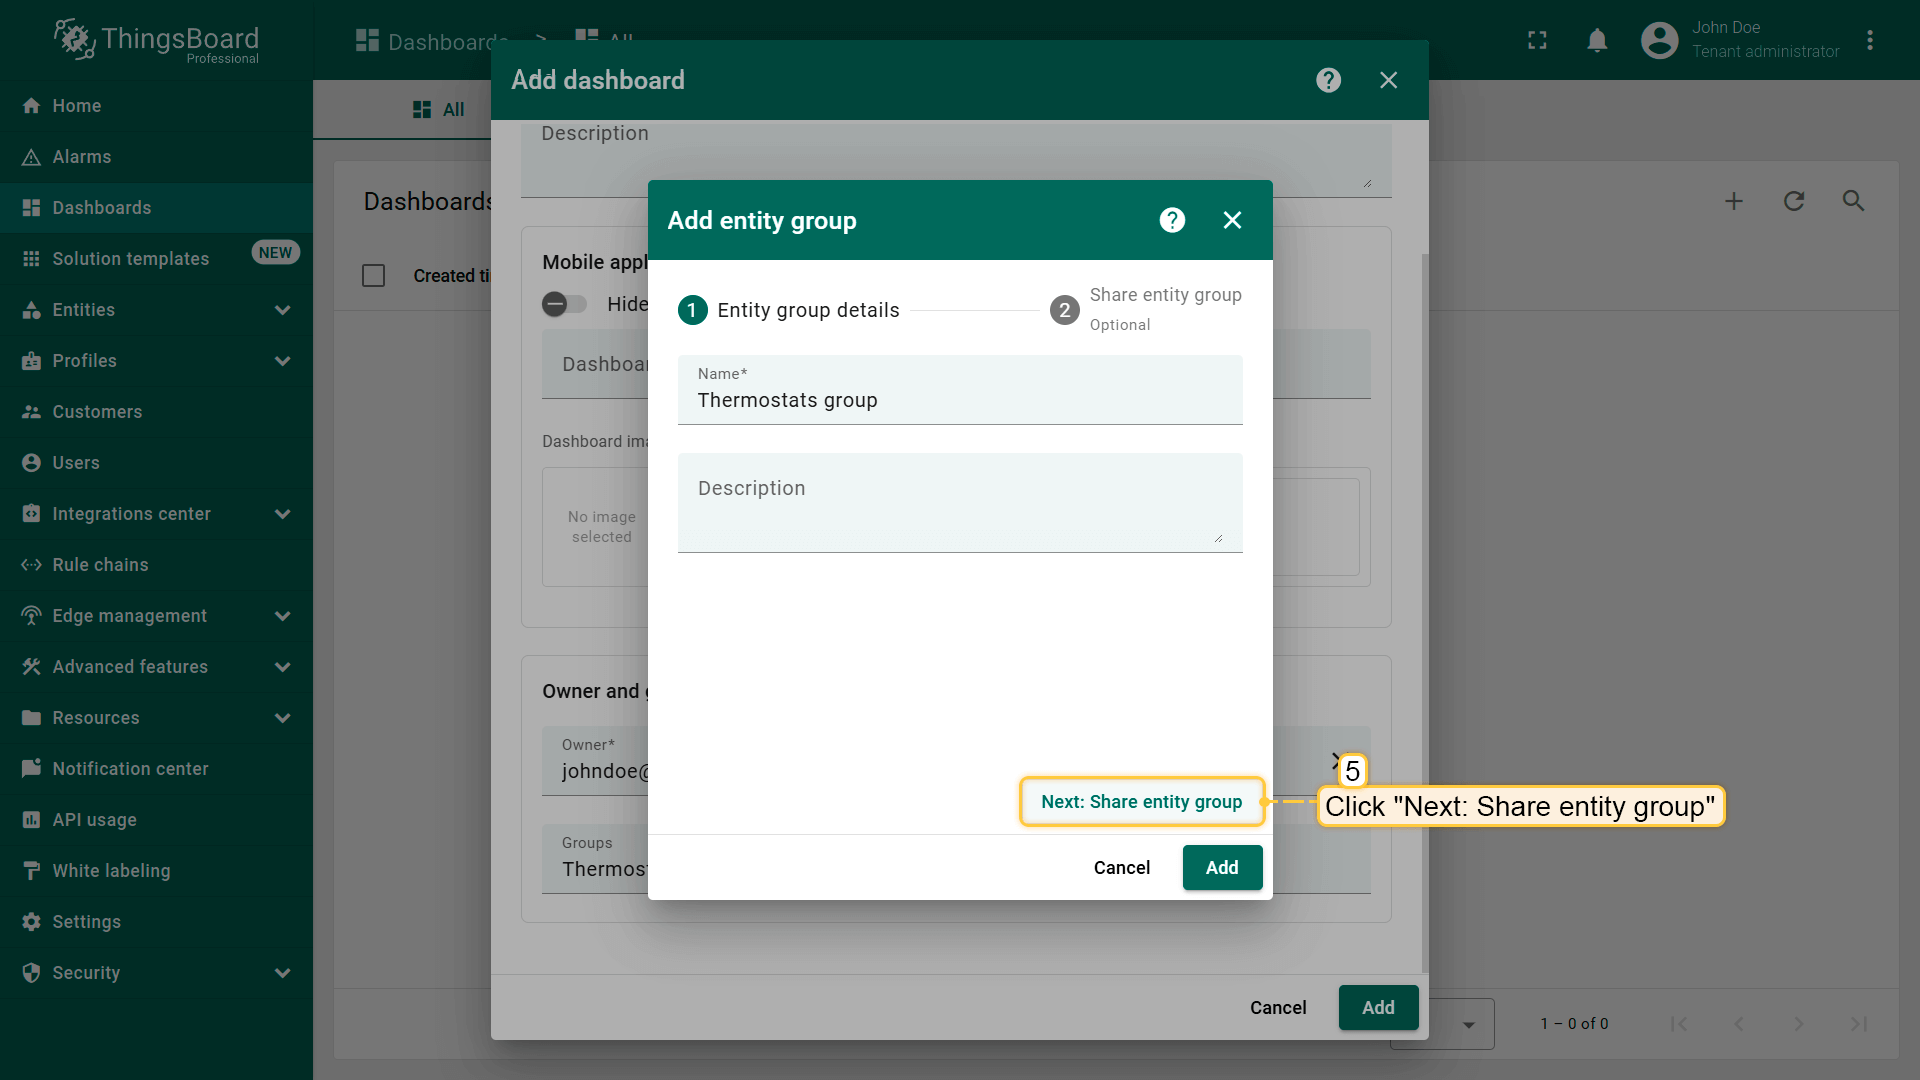
- In the "Add entity group" window that opens, click "Next: Share entity group";
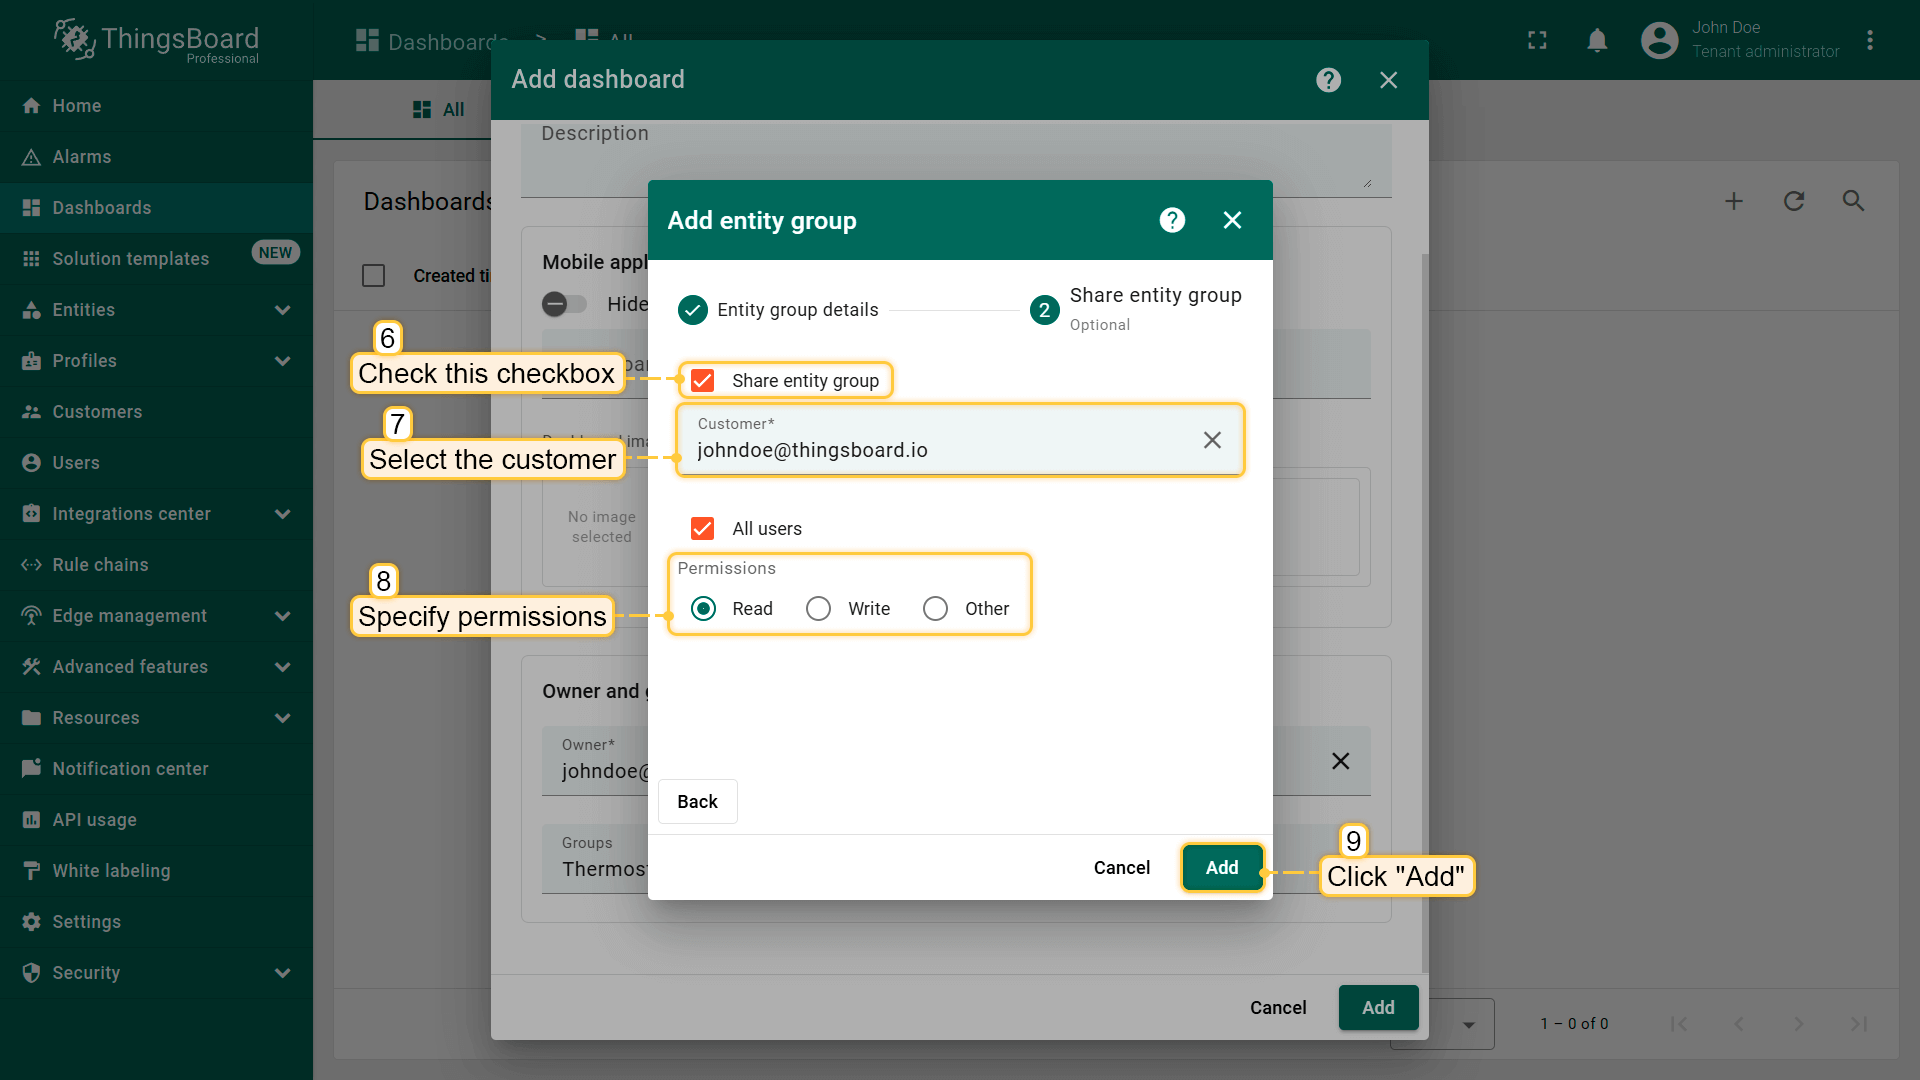
- Check the "Share entity group" box, select the customer to share the dashboard with, and set their permissions. Then click "Add";
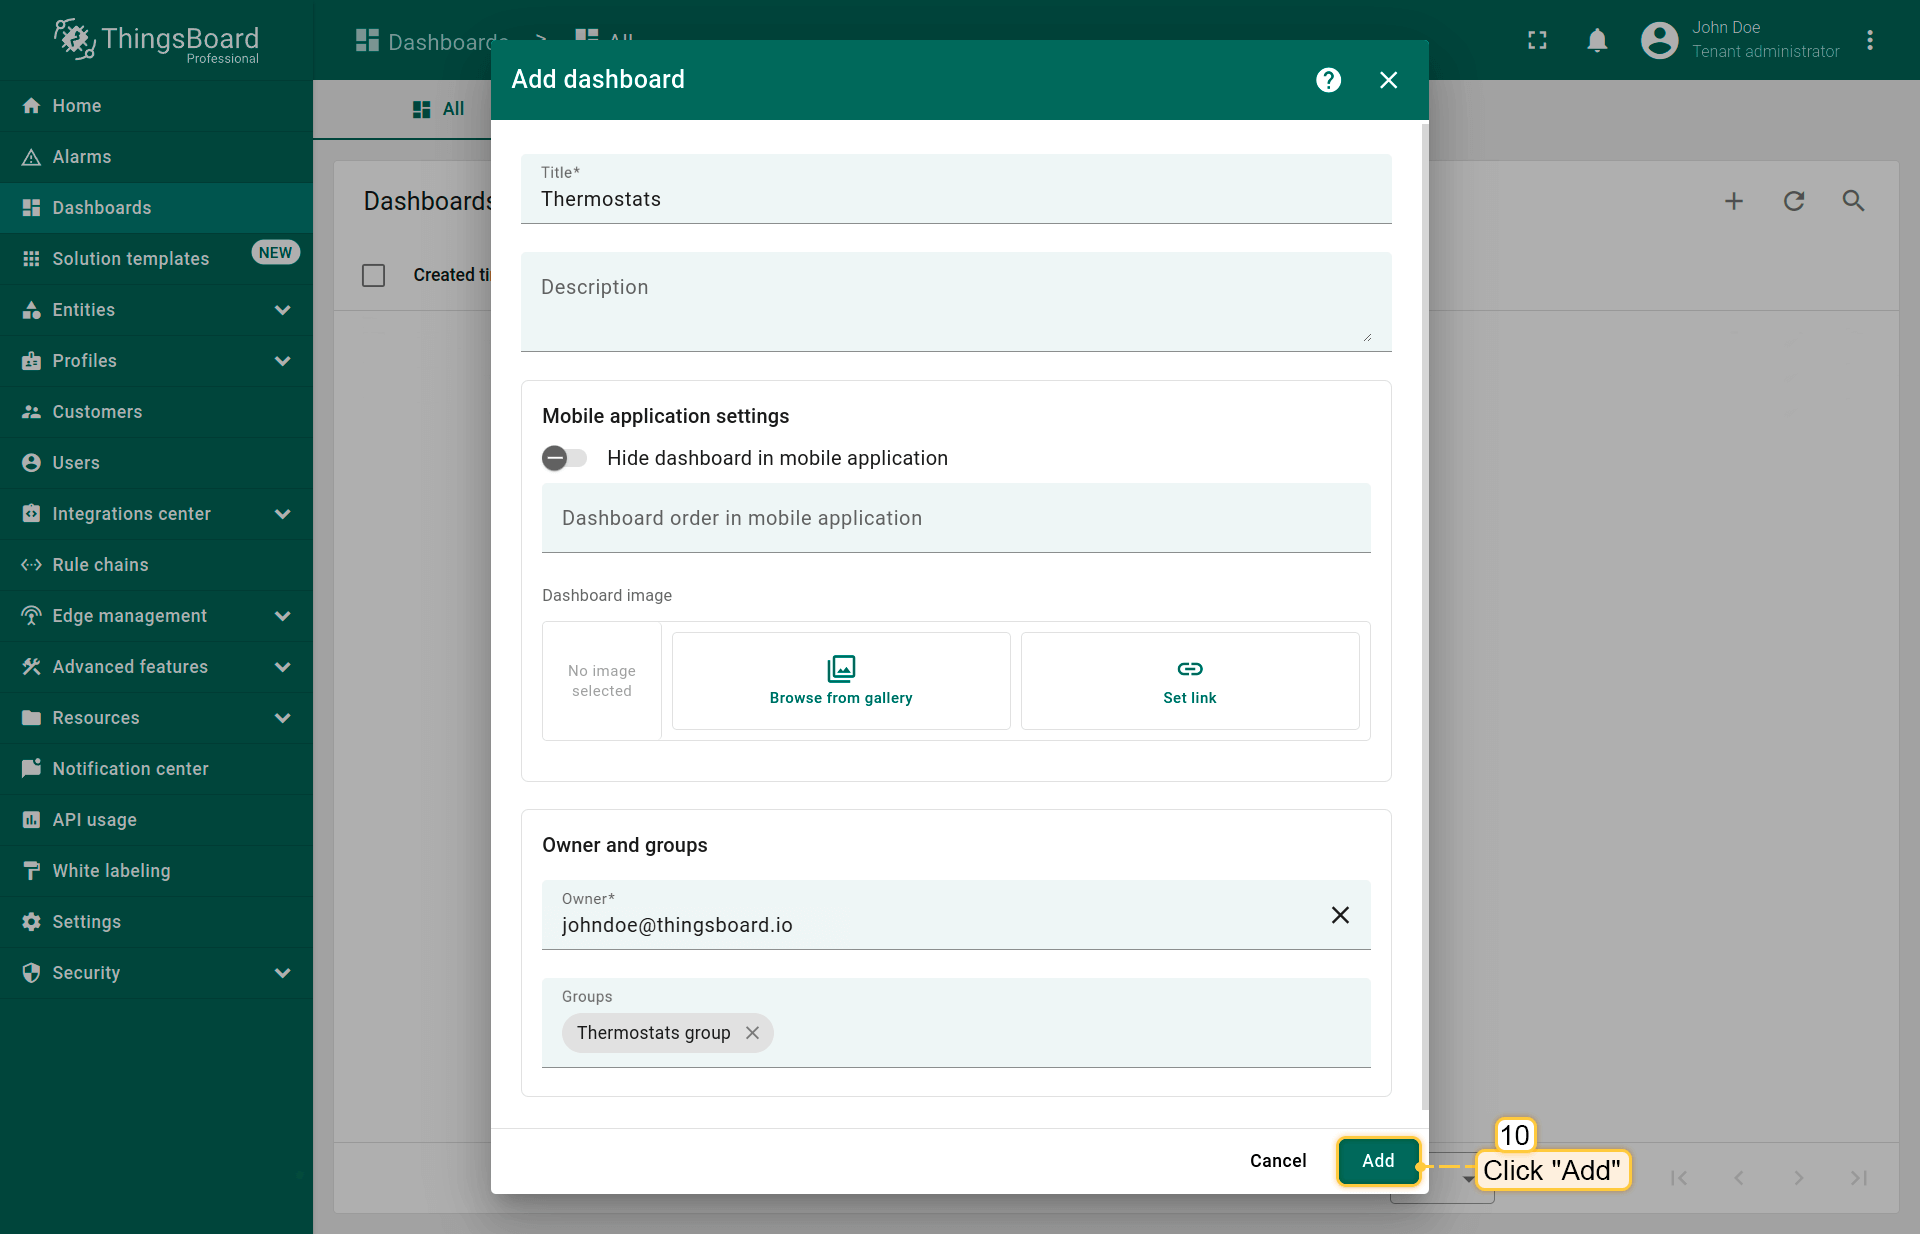
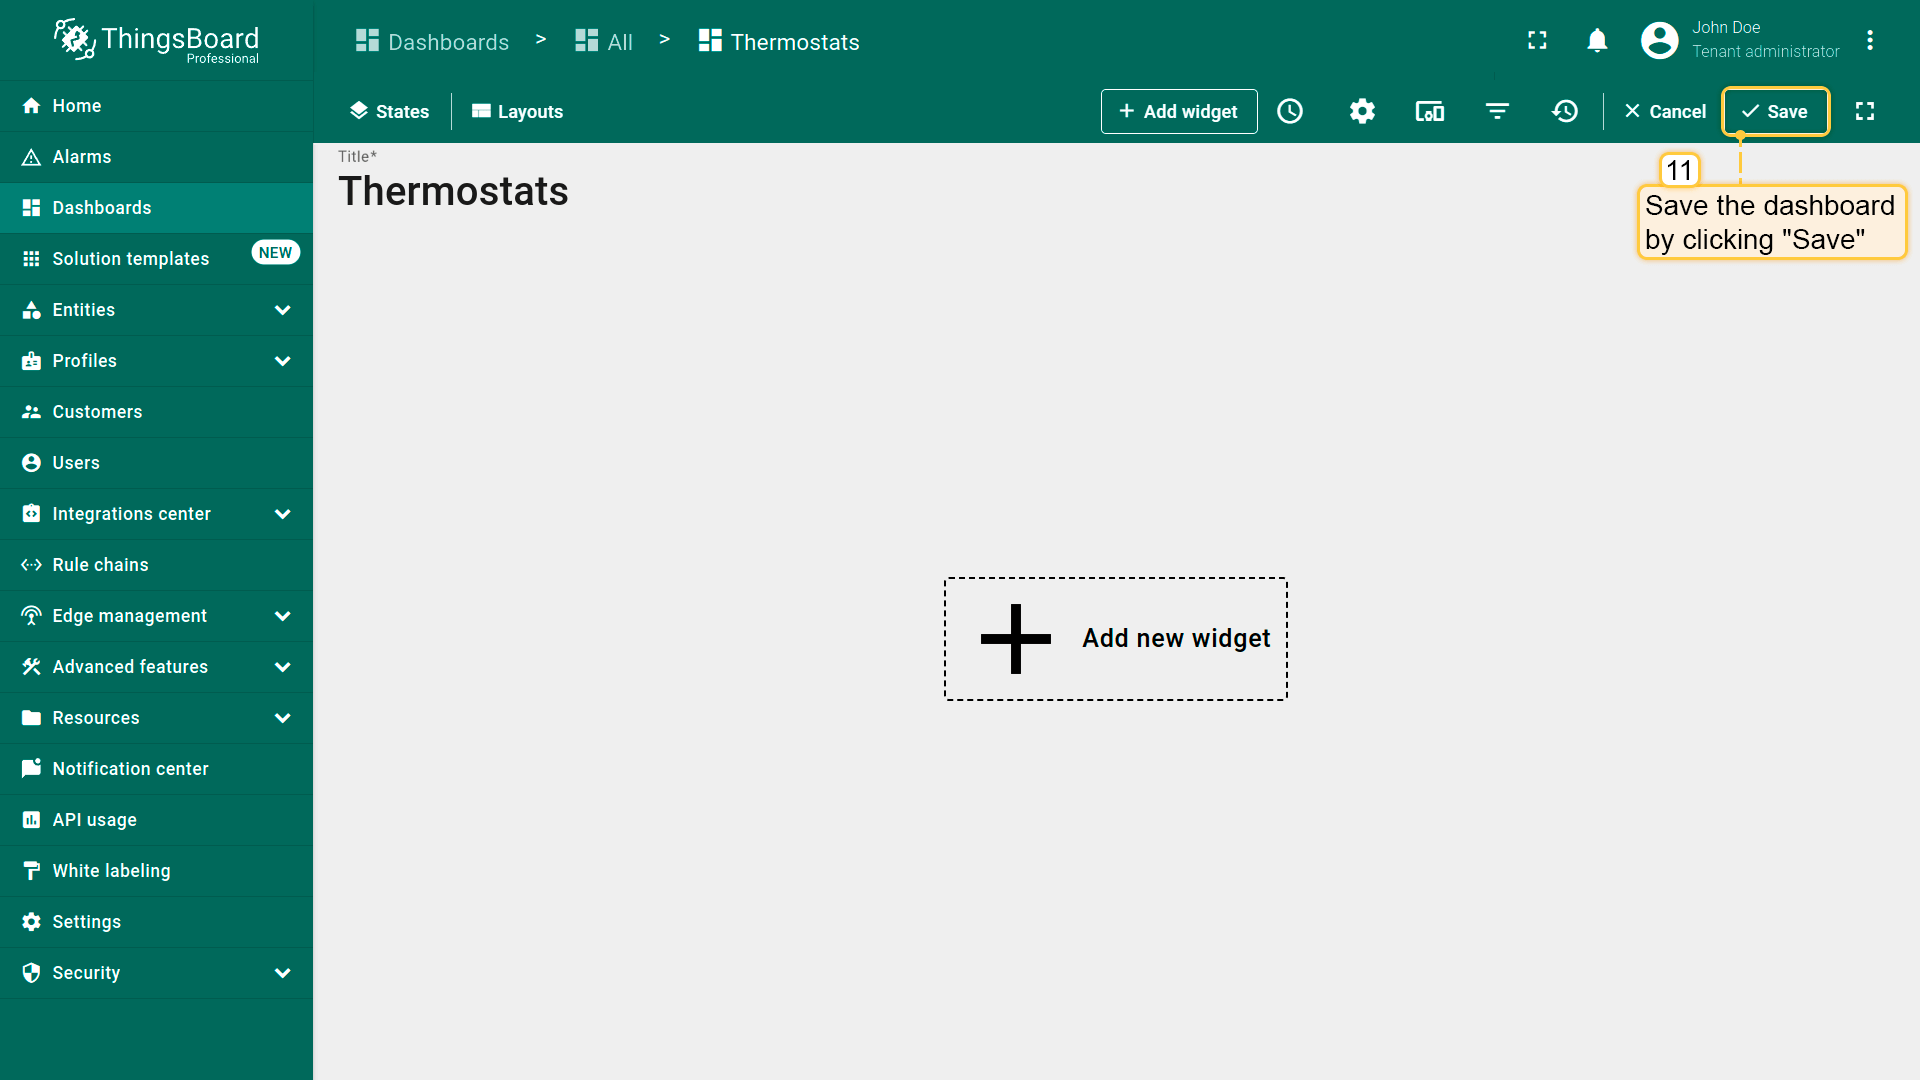
- Click "Add" again to confirm dashboard creation;
- The new dashboard will open automatically — click "Save" in the top-right corner;
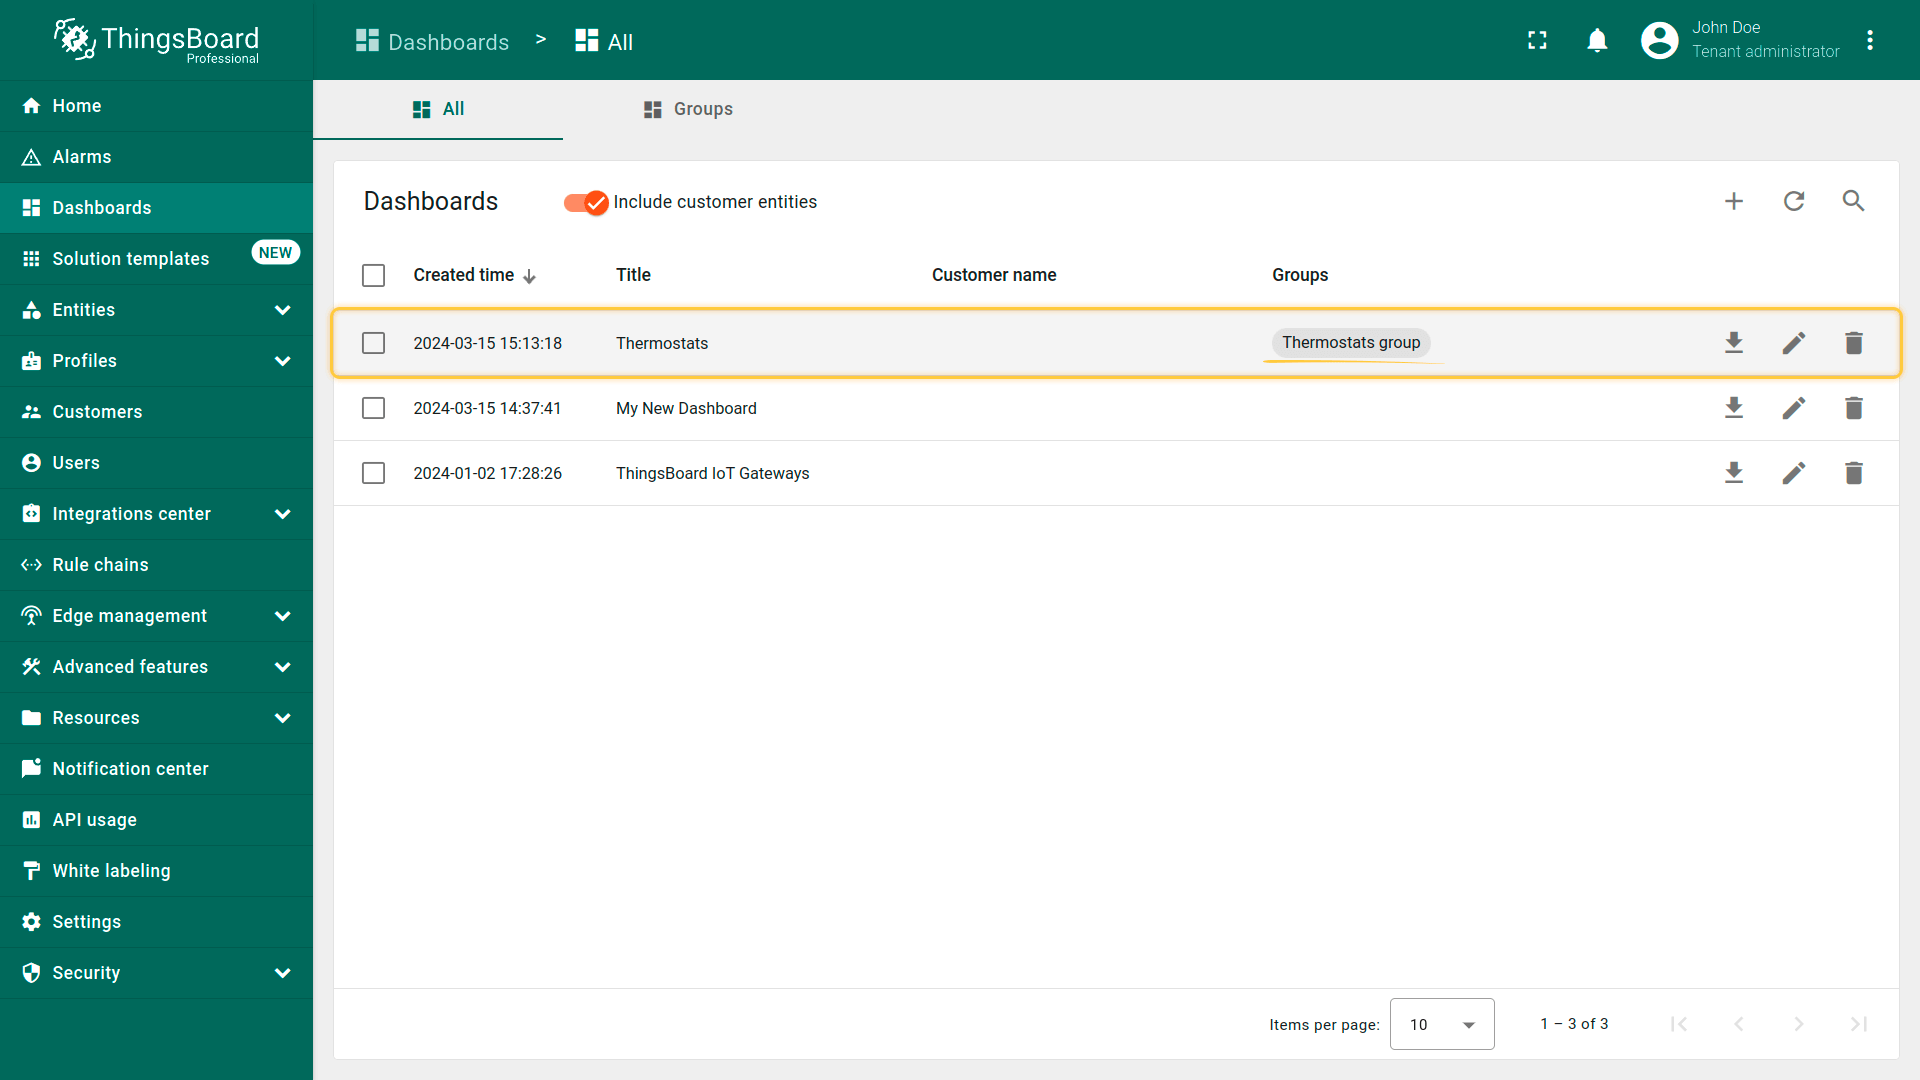
- Your dashboard has been created and placed in the "Thermostats group". You can quickly access it by clicking the group name.
Step 7.4 Create a customer user
Now, let's create a user that will belong to the customer and will have read-only access both to the dashboard and the device itself.
You may optionally configure the dashboard to appear just after user logs in to the platform's web UI.
- Open "Customers hierarchy", select "Customer Users" and click "Add".
- Specify email, first and last name. Click "Add".
- Copy the activation link and save it to a safe place. Then click "OK".
- Click on the user name to open user details. Toggle edit mode.
- Optionally, select the dashboard and enable "always fullscreen" mode. Apply changes.


Step 7.5 Activate the customer user
Finally, log in to IoT Hub as a customer user.
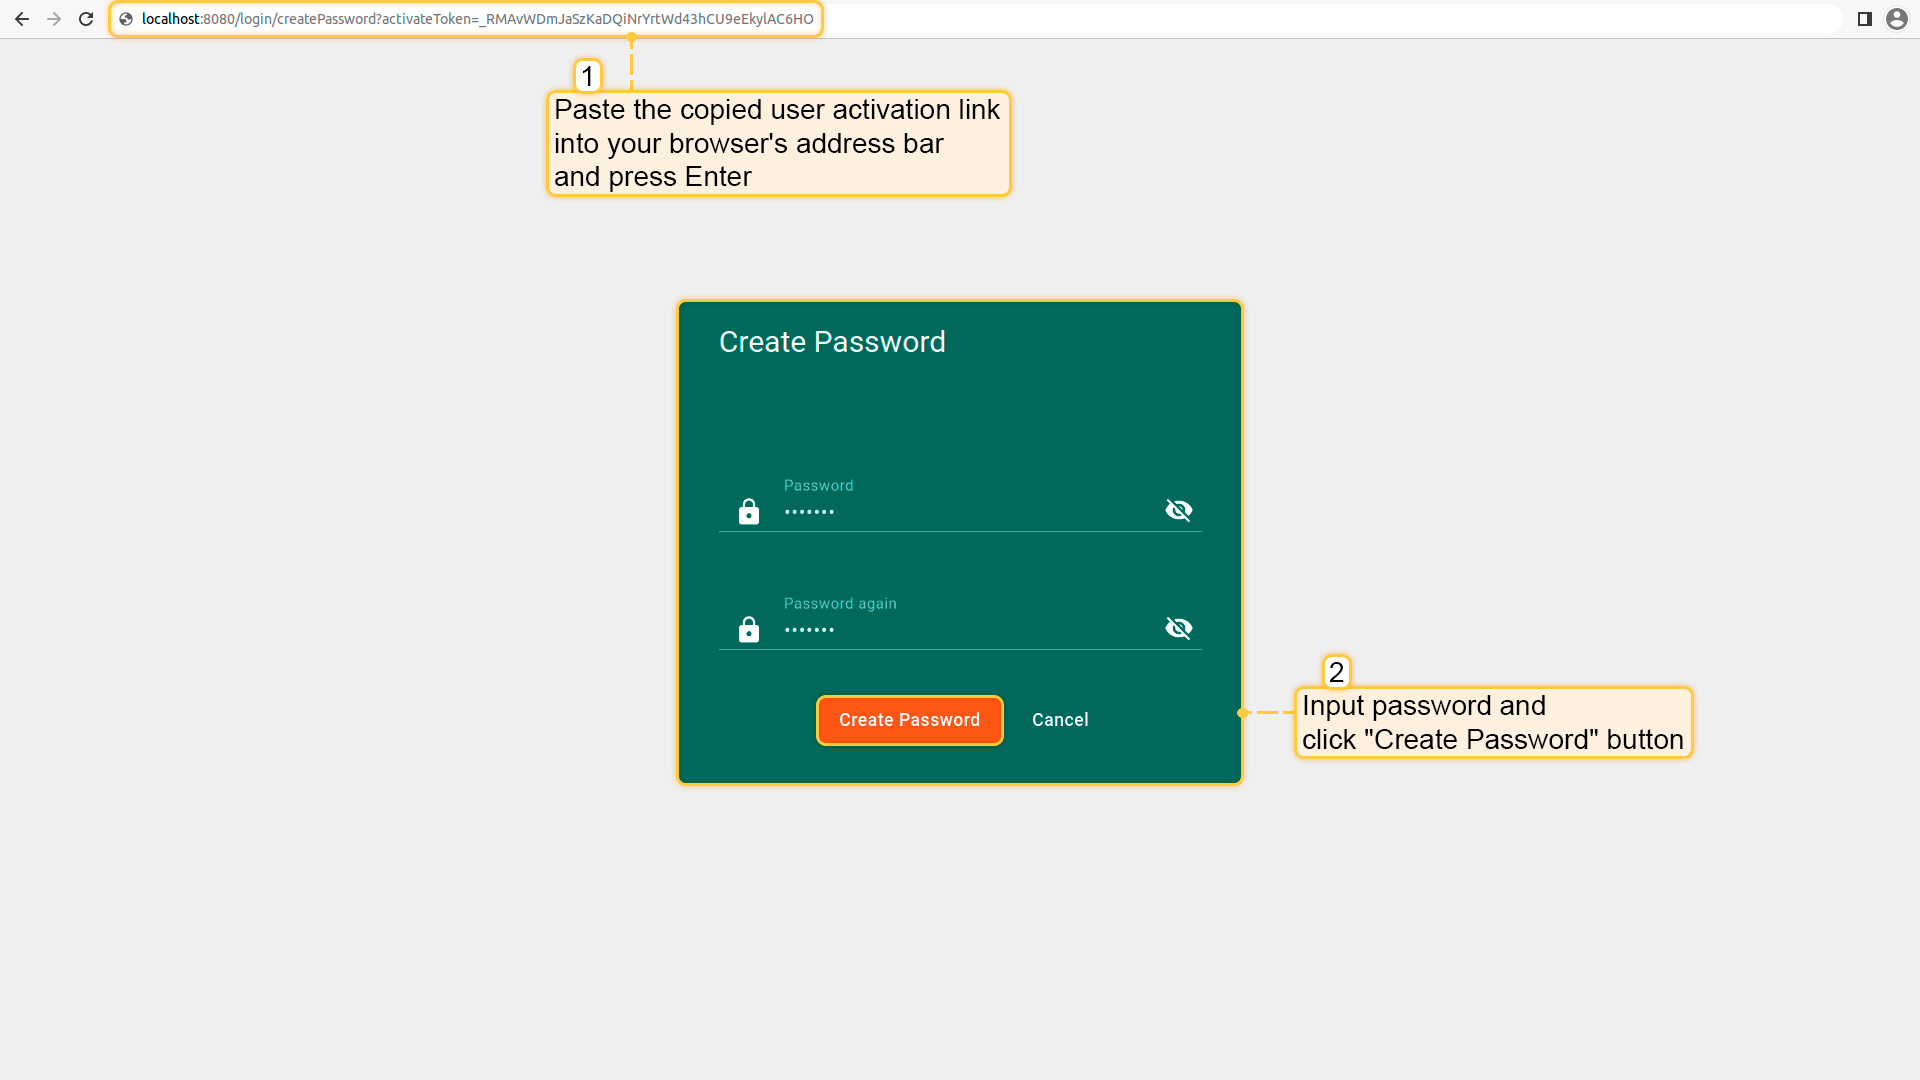
- Paste the previously copied link into a new browser tab and press the “Enter” key. Now create a password by entering it twice and clicking “Create Password”.
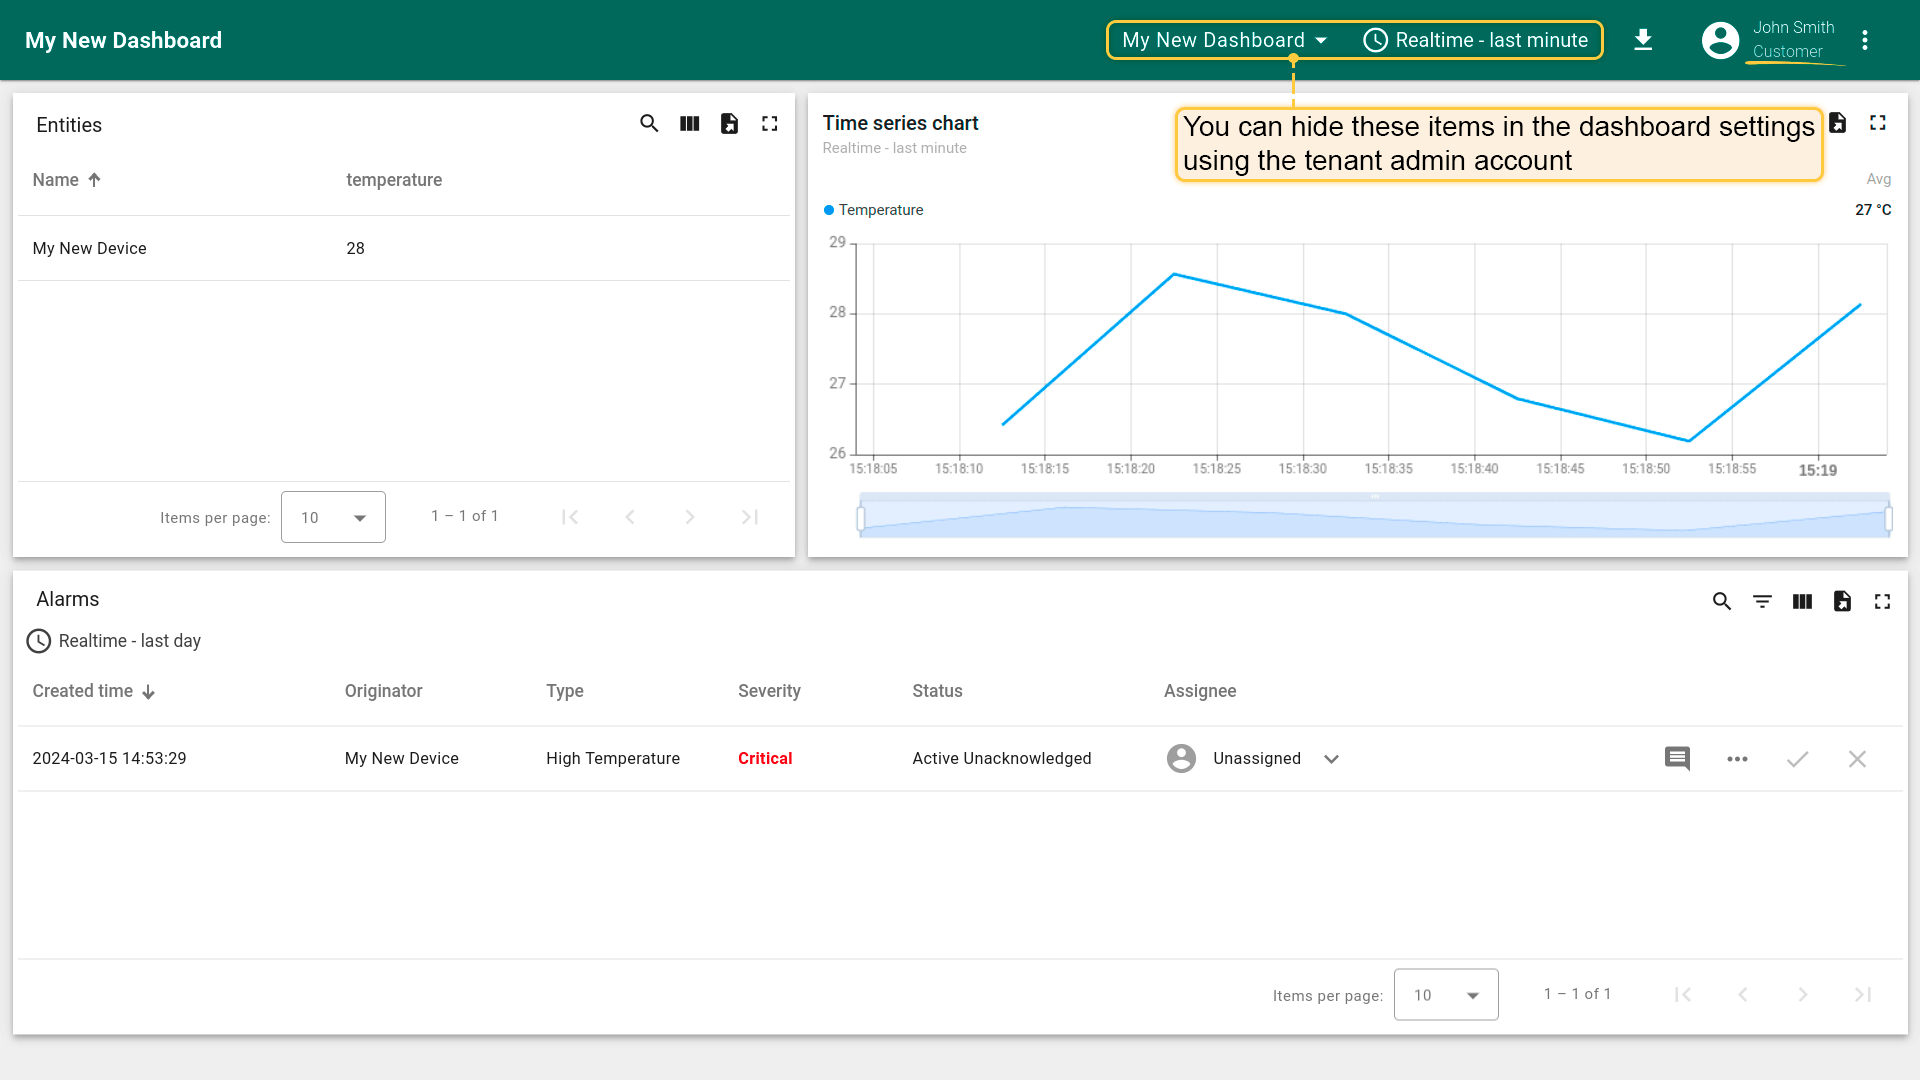
- You are now logged in as a customer user. Since this user has read-only access, you can view device data and its alarms, but you cannot acknowledge or clear them.
To learn more about permissions and role-based access control (RBAC), click here.
Next steps
-
Connect your device - Learn how to connect devices based on your connectivity technology or solution.
-
Data visualization - These guides contain instructions on how to configure complex IoT Hub dashboards.
-
Data processing & actions - Learn how to use IoT Hub Rule Engine.
-
IoT Data analytics - Learn how to use rule engine to perform basic analytics tasks.
-
Hardware samples - Learn how to connect various hardware platforms to IoT Hub.
-
Advanced features - Learn about advanced IoT Hub features.
Your feedback
If you have any questions about this sample, please contact us - service4iot@magenta.at.